Research Dashboard
Phase 6 introduces adaptive iPad and macOS research workspaces with Overview, Live Console, Sessions, Analysis Runs, Objects, Tracks, Collections, Performance, Warnings and Logs, and Settings sections.
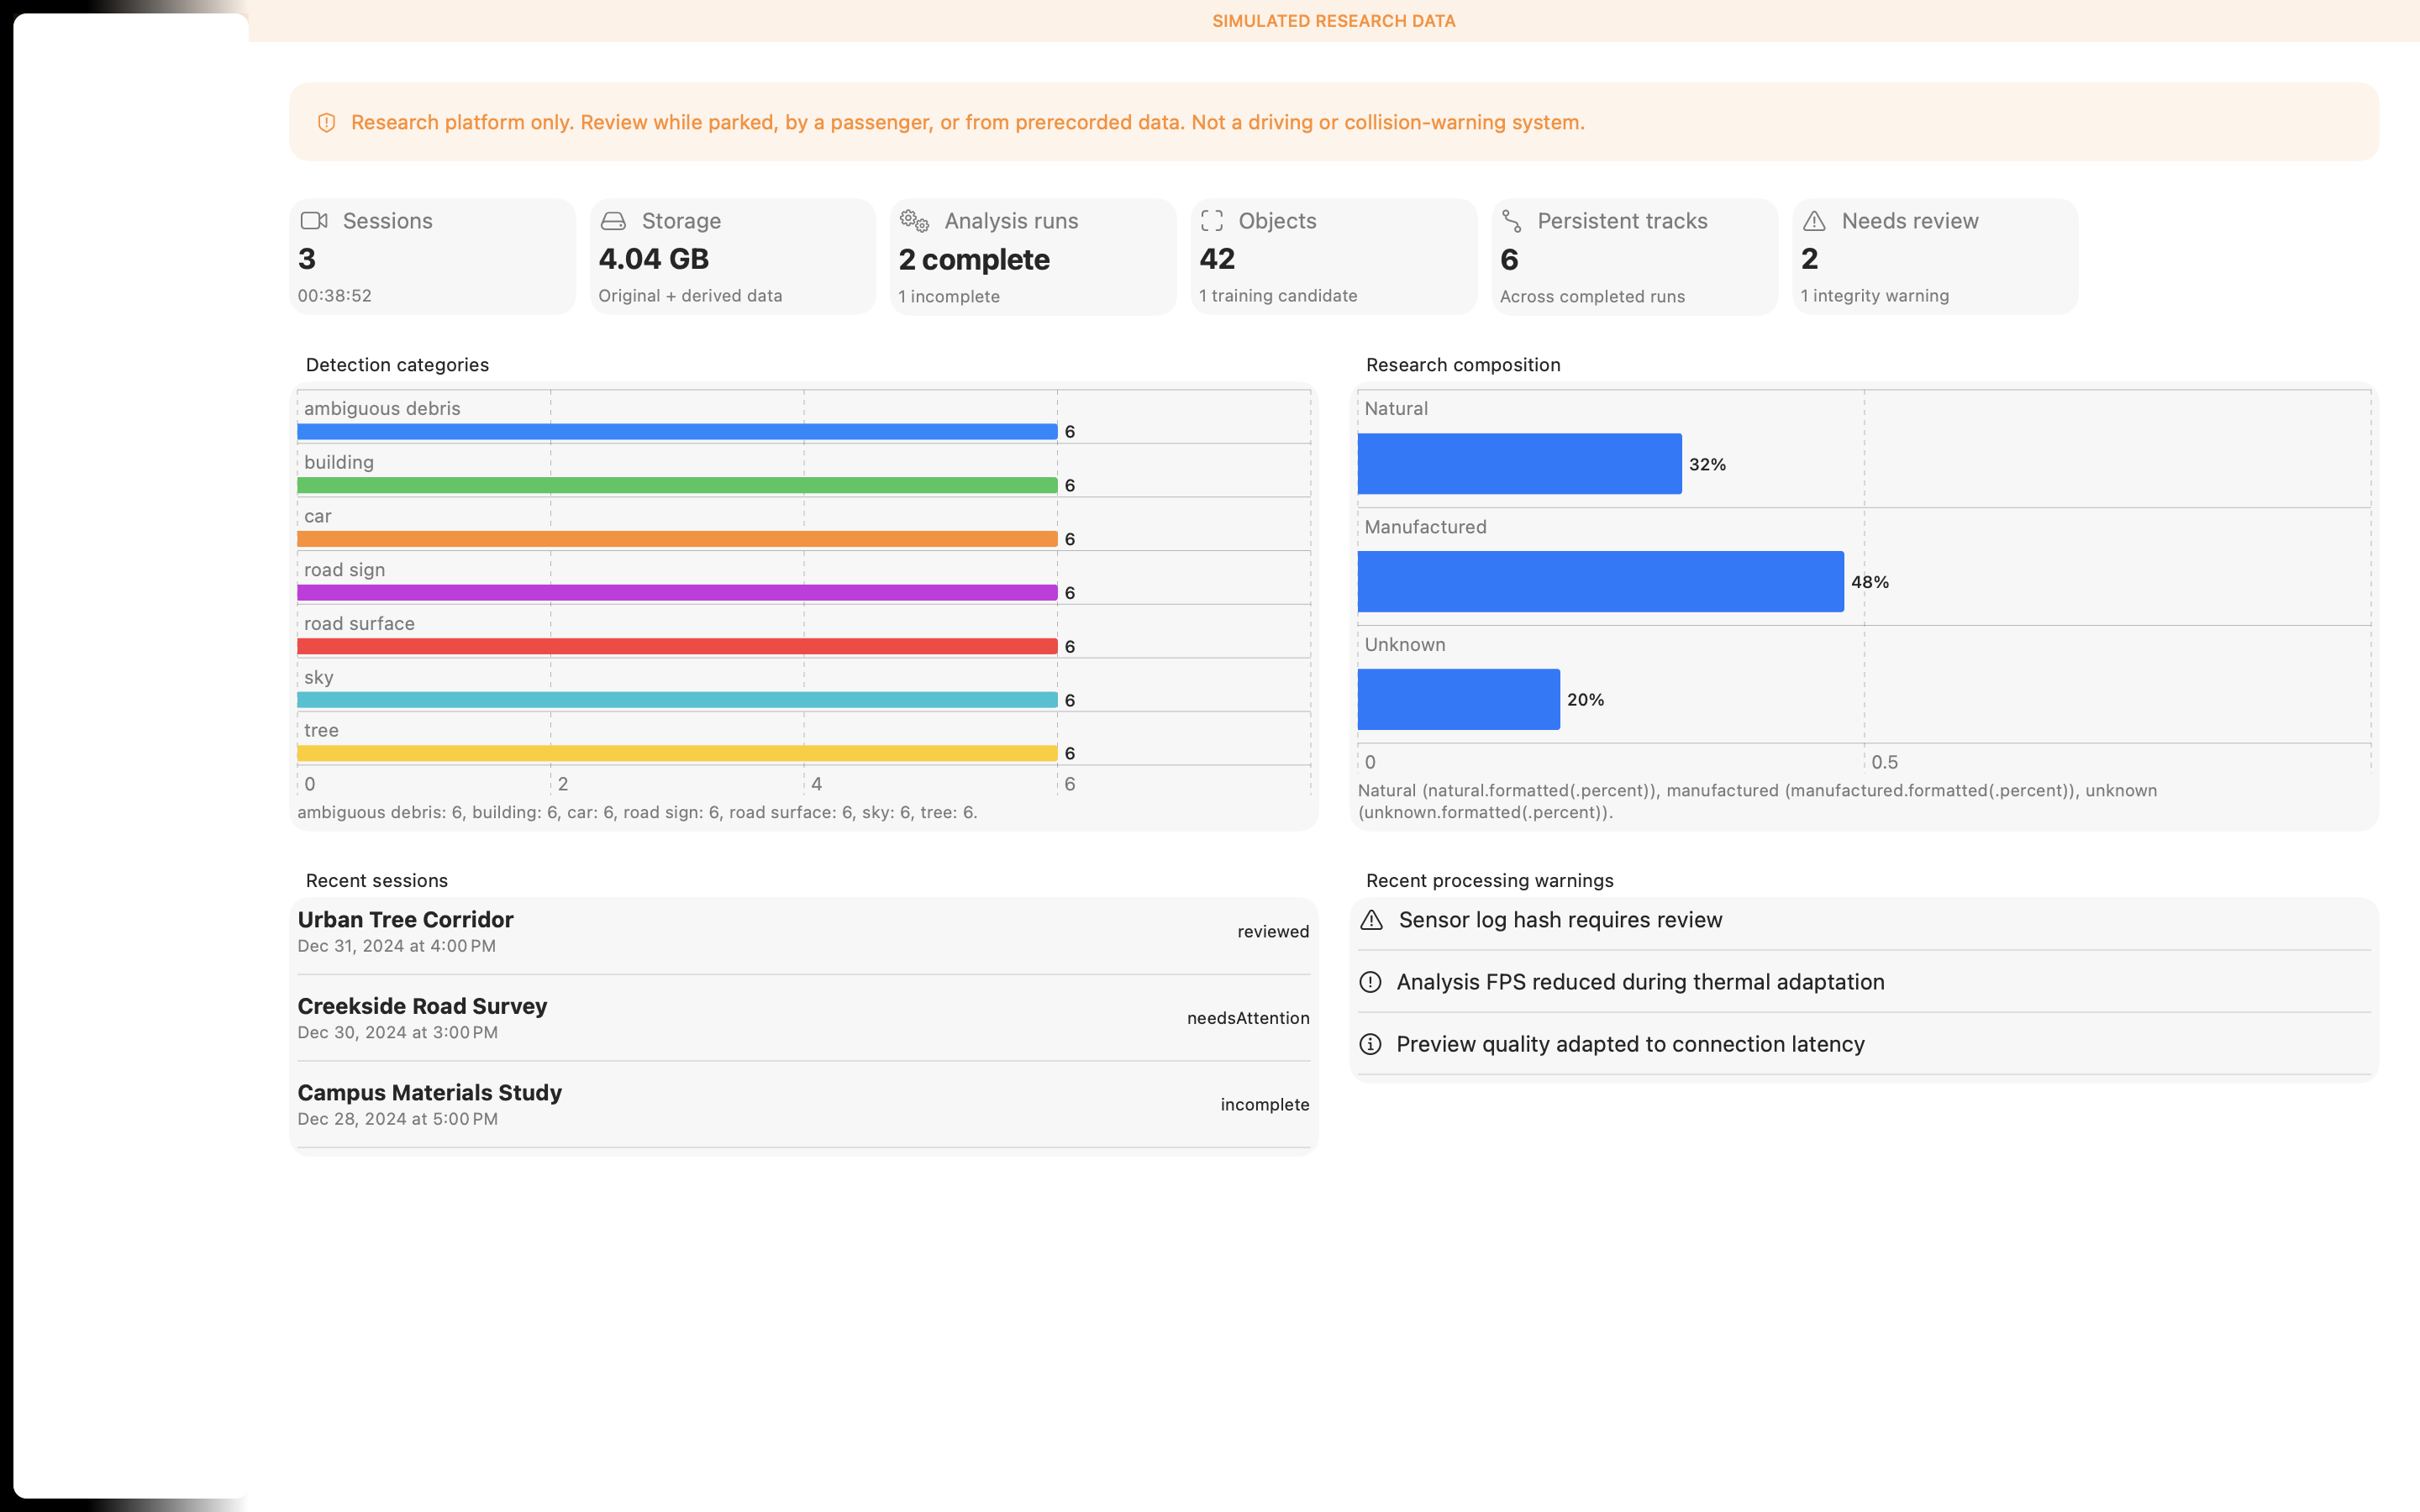
The dashboard consumes existing catalog and analysis models through DashboardAggregationService. Deterministic fixture data is used only when demonstration launch arguments are present. Overview summaries aggregate indexes rather than opening every result file.
Phase 7 connects reviewed objects to separate annotation projects and training eligibility. AI and human states remain distinguishable; the dashboard never mutates analysis results.
Accessibility
Navigation and principal controls have descriptive labels and identifiers. Charts include text summaries and values, so meaning does not depend on color. The layout supports Dynamic Type, keyboard and pointer interaction, logical focus, sufficient contrast, and reduced-motion demonstration arguments.
Large catalogs
Production adapters should page catalog and object queries, cache chart summaries, aggregate dense timelines, and cancel background work when selection changes. The deterministic aggregation interfaces are synchronous fixtures; storage-backed paging remains behind dataset boundaries.