OrganicVision Application Tour
Human-recorded physical results
Diagnostic screens guide tests, while PhysicalValidation/ records the human outcome. Symbols and text are paired: ✓ Passed, ⚠︎ Passed with warnings, ✕ Failed, ⊘ Blocked, ↷ Skipped, — Unsupported, and ○ Not tested. Current physical records contain only Blocked and Not tested states.
Physical-device readiness
The diagnostic route presents guided camera, sensor, storage, power, networking, transfer, external-media, playback, and accessibility checks. Every demo view displays Simulated Diagnostic Data. iPad and macOS also provide release summaries and redacted diagnostic review.
Phase 10 cameras and video sources
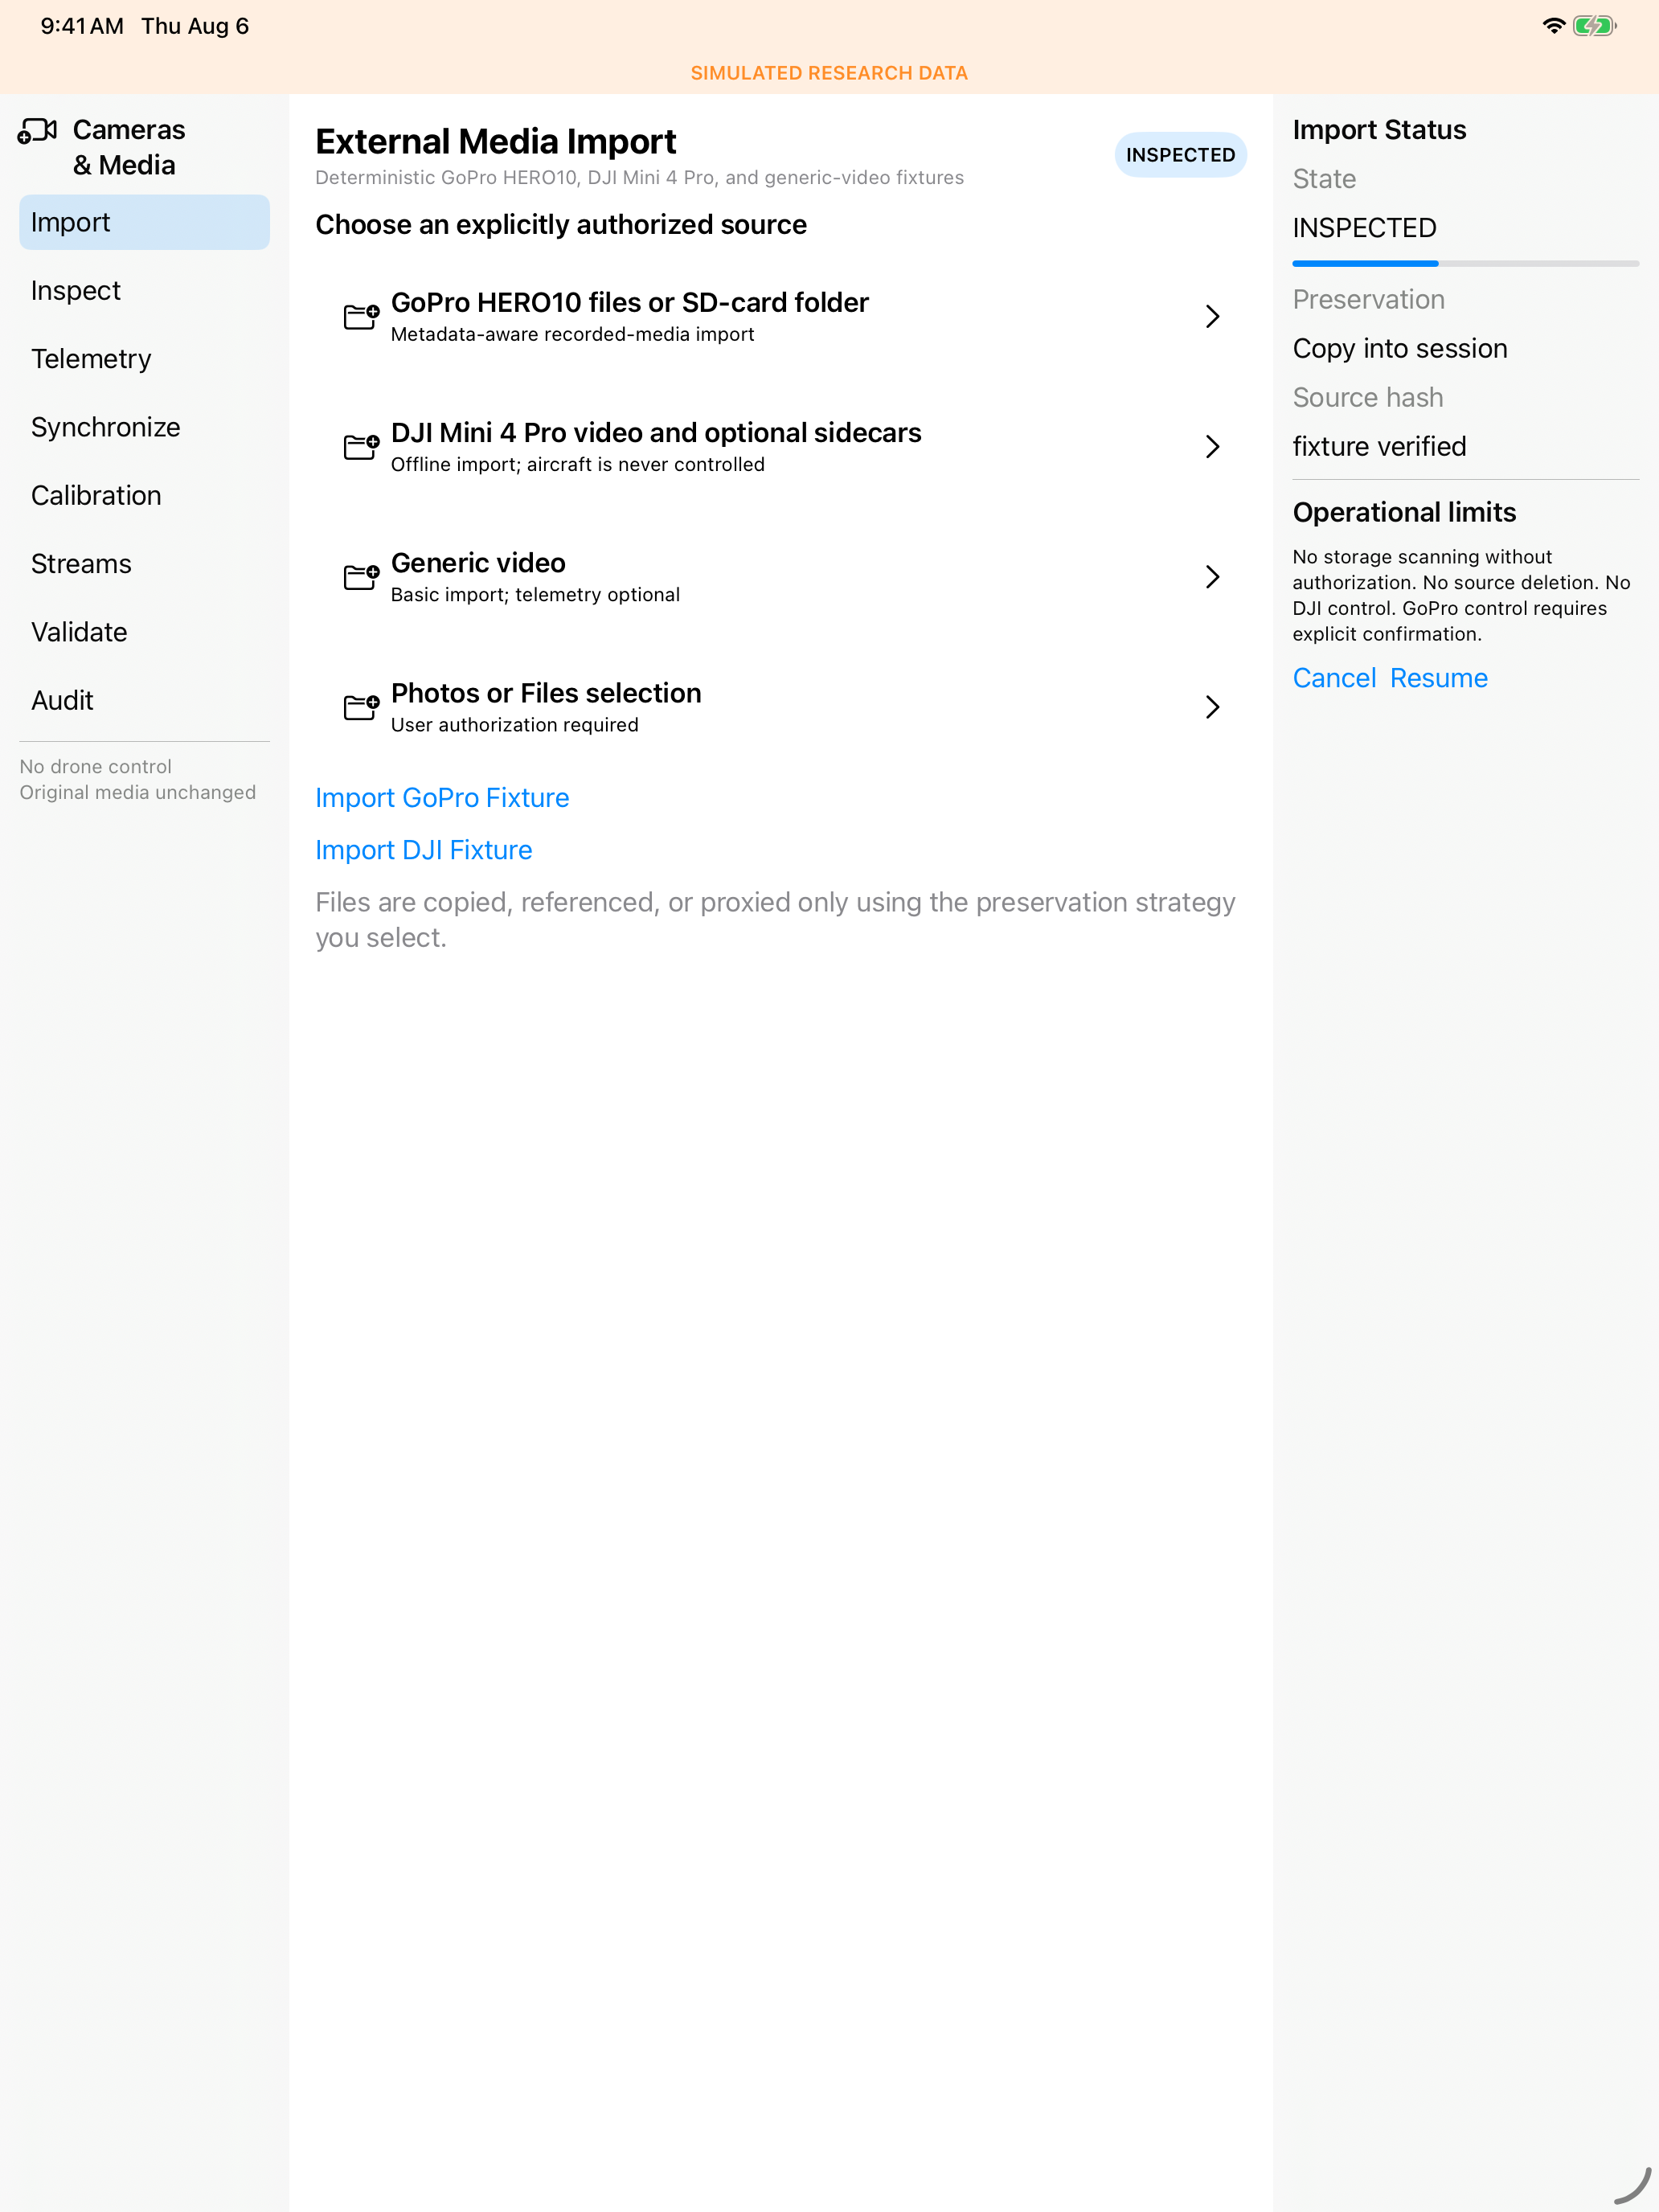
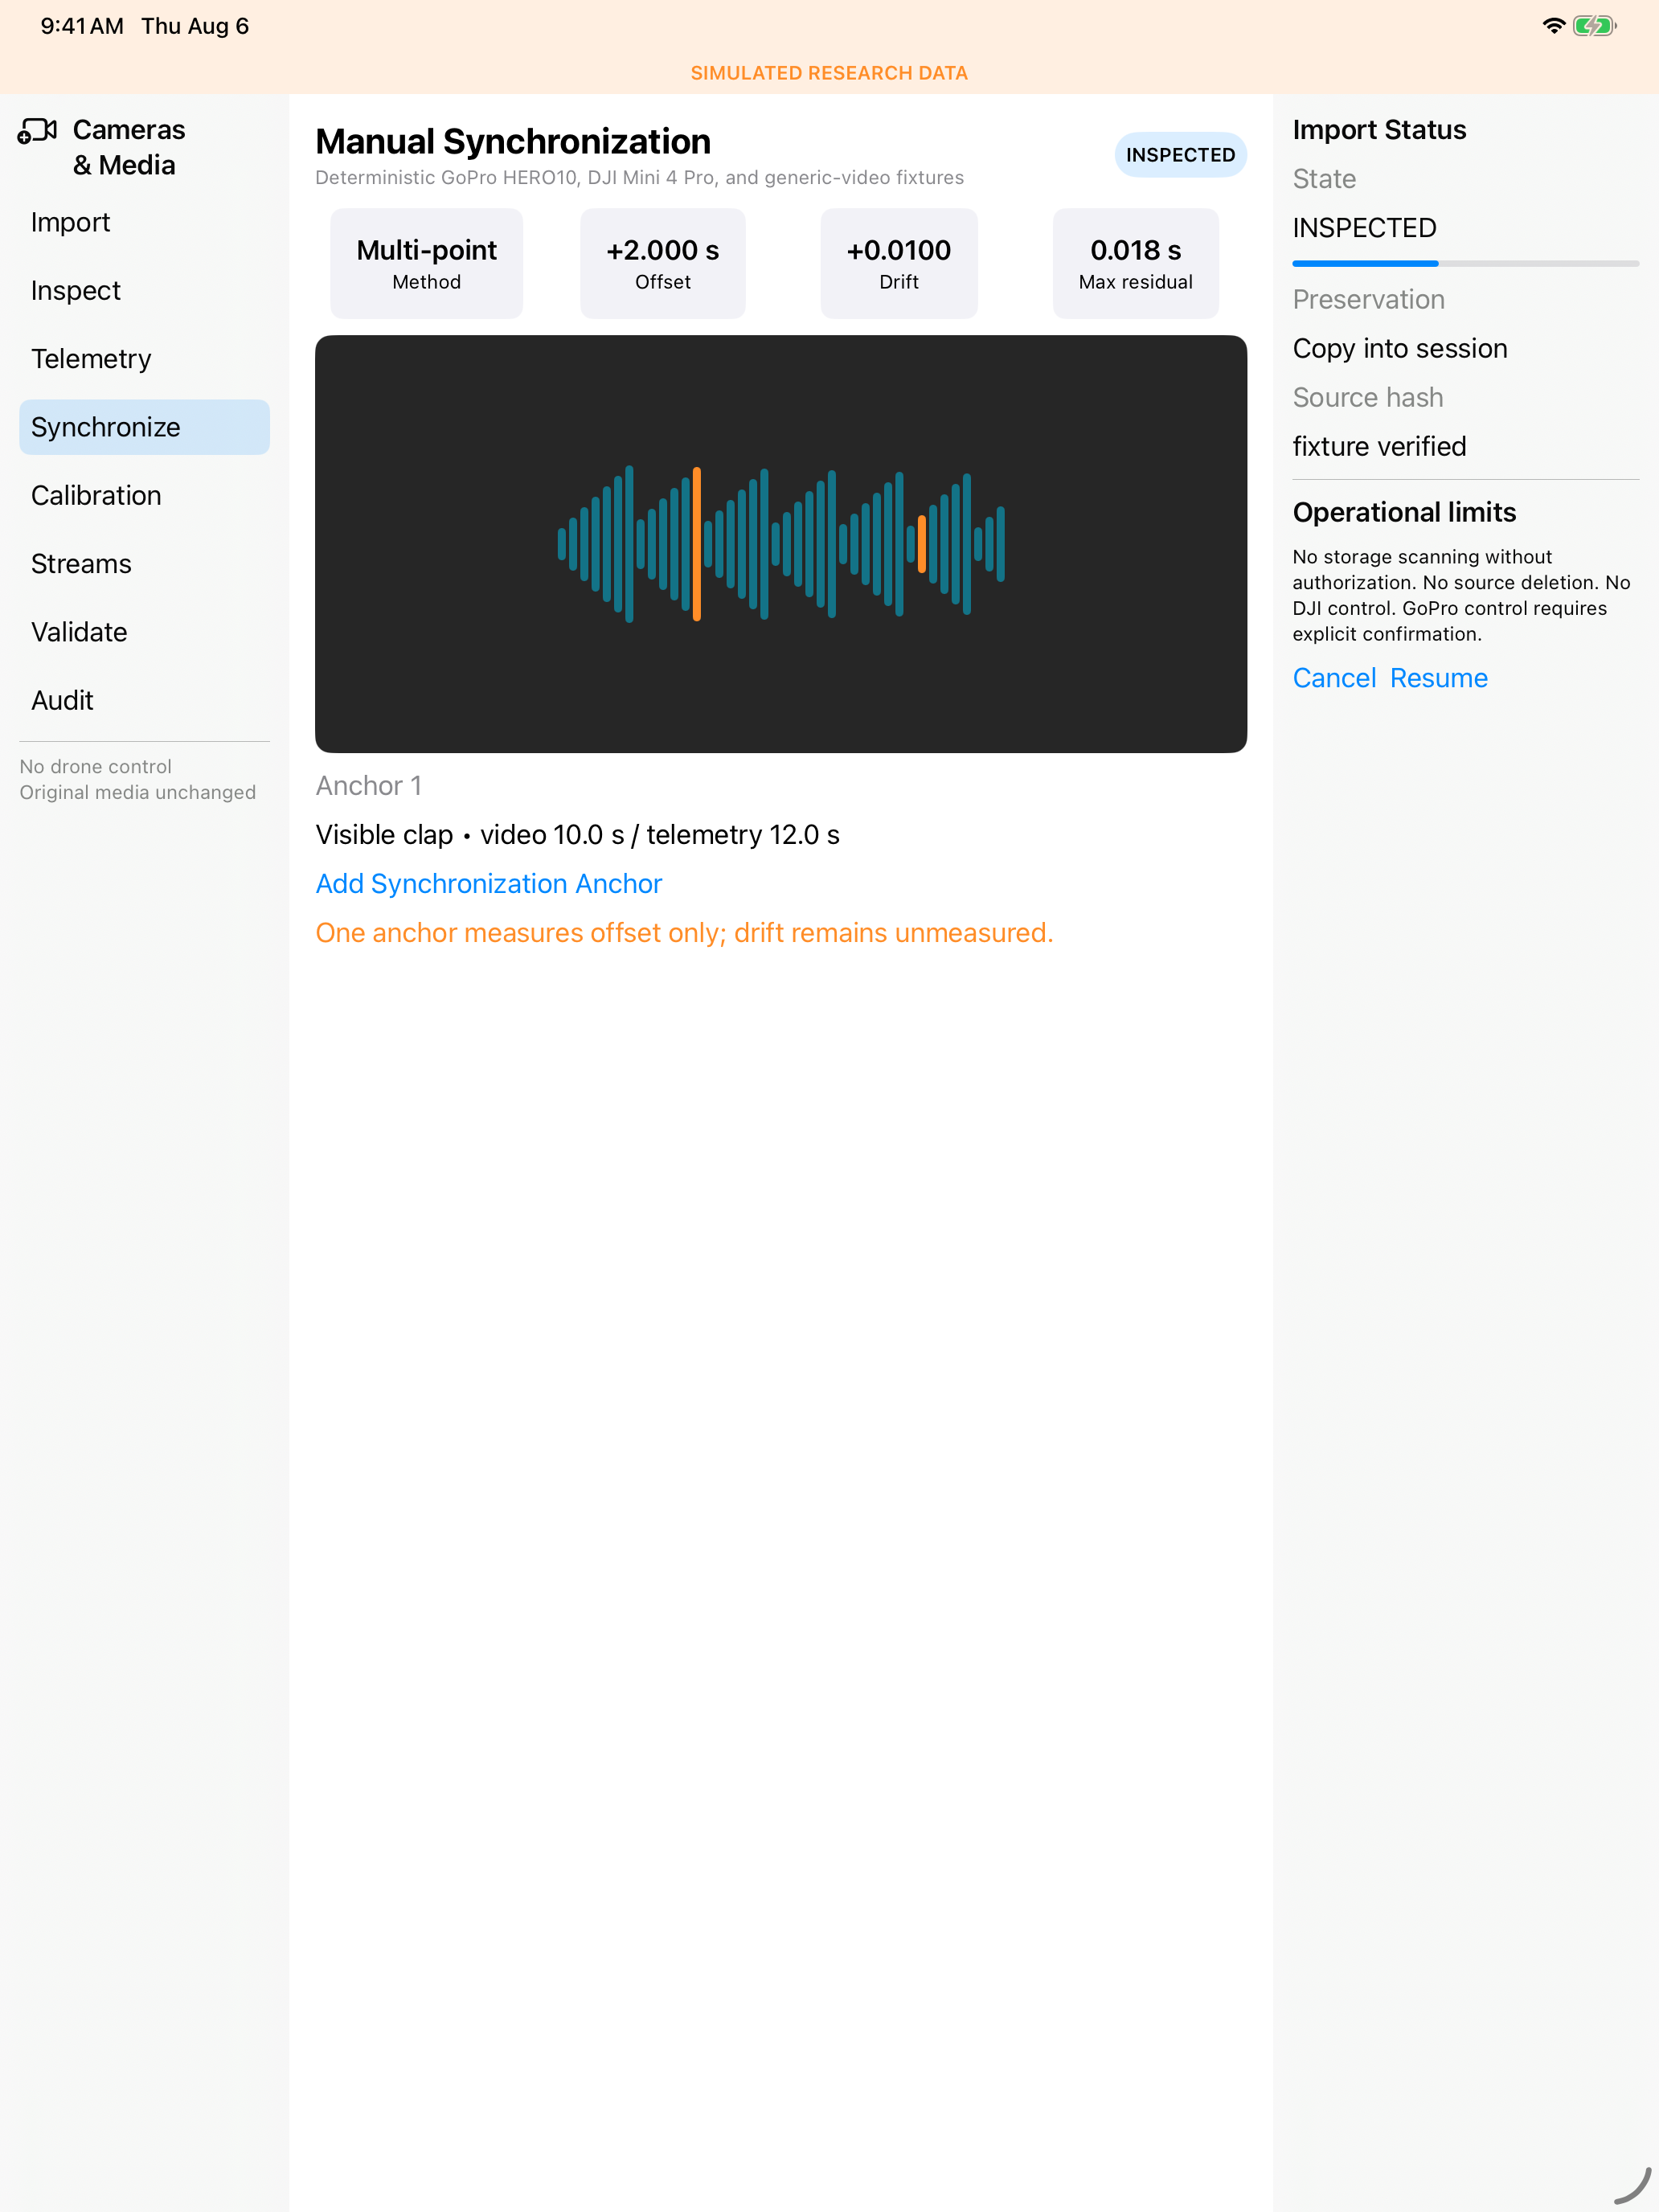
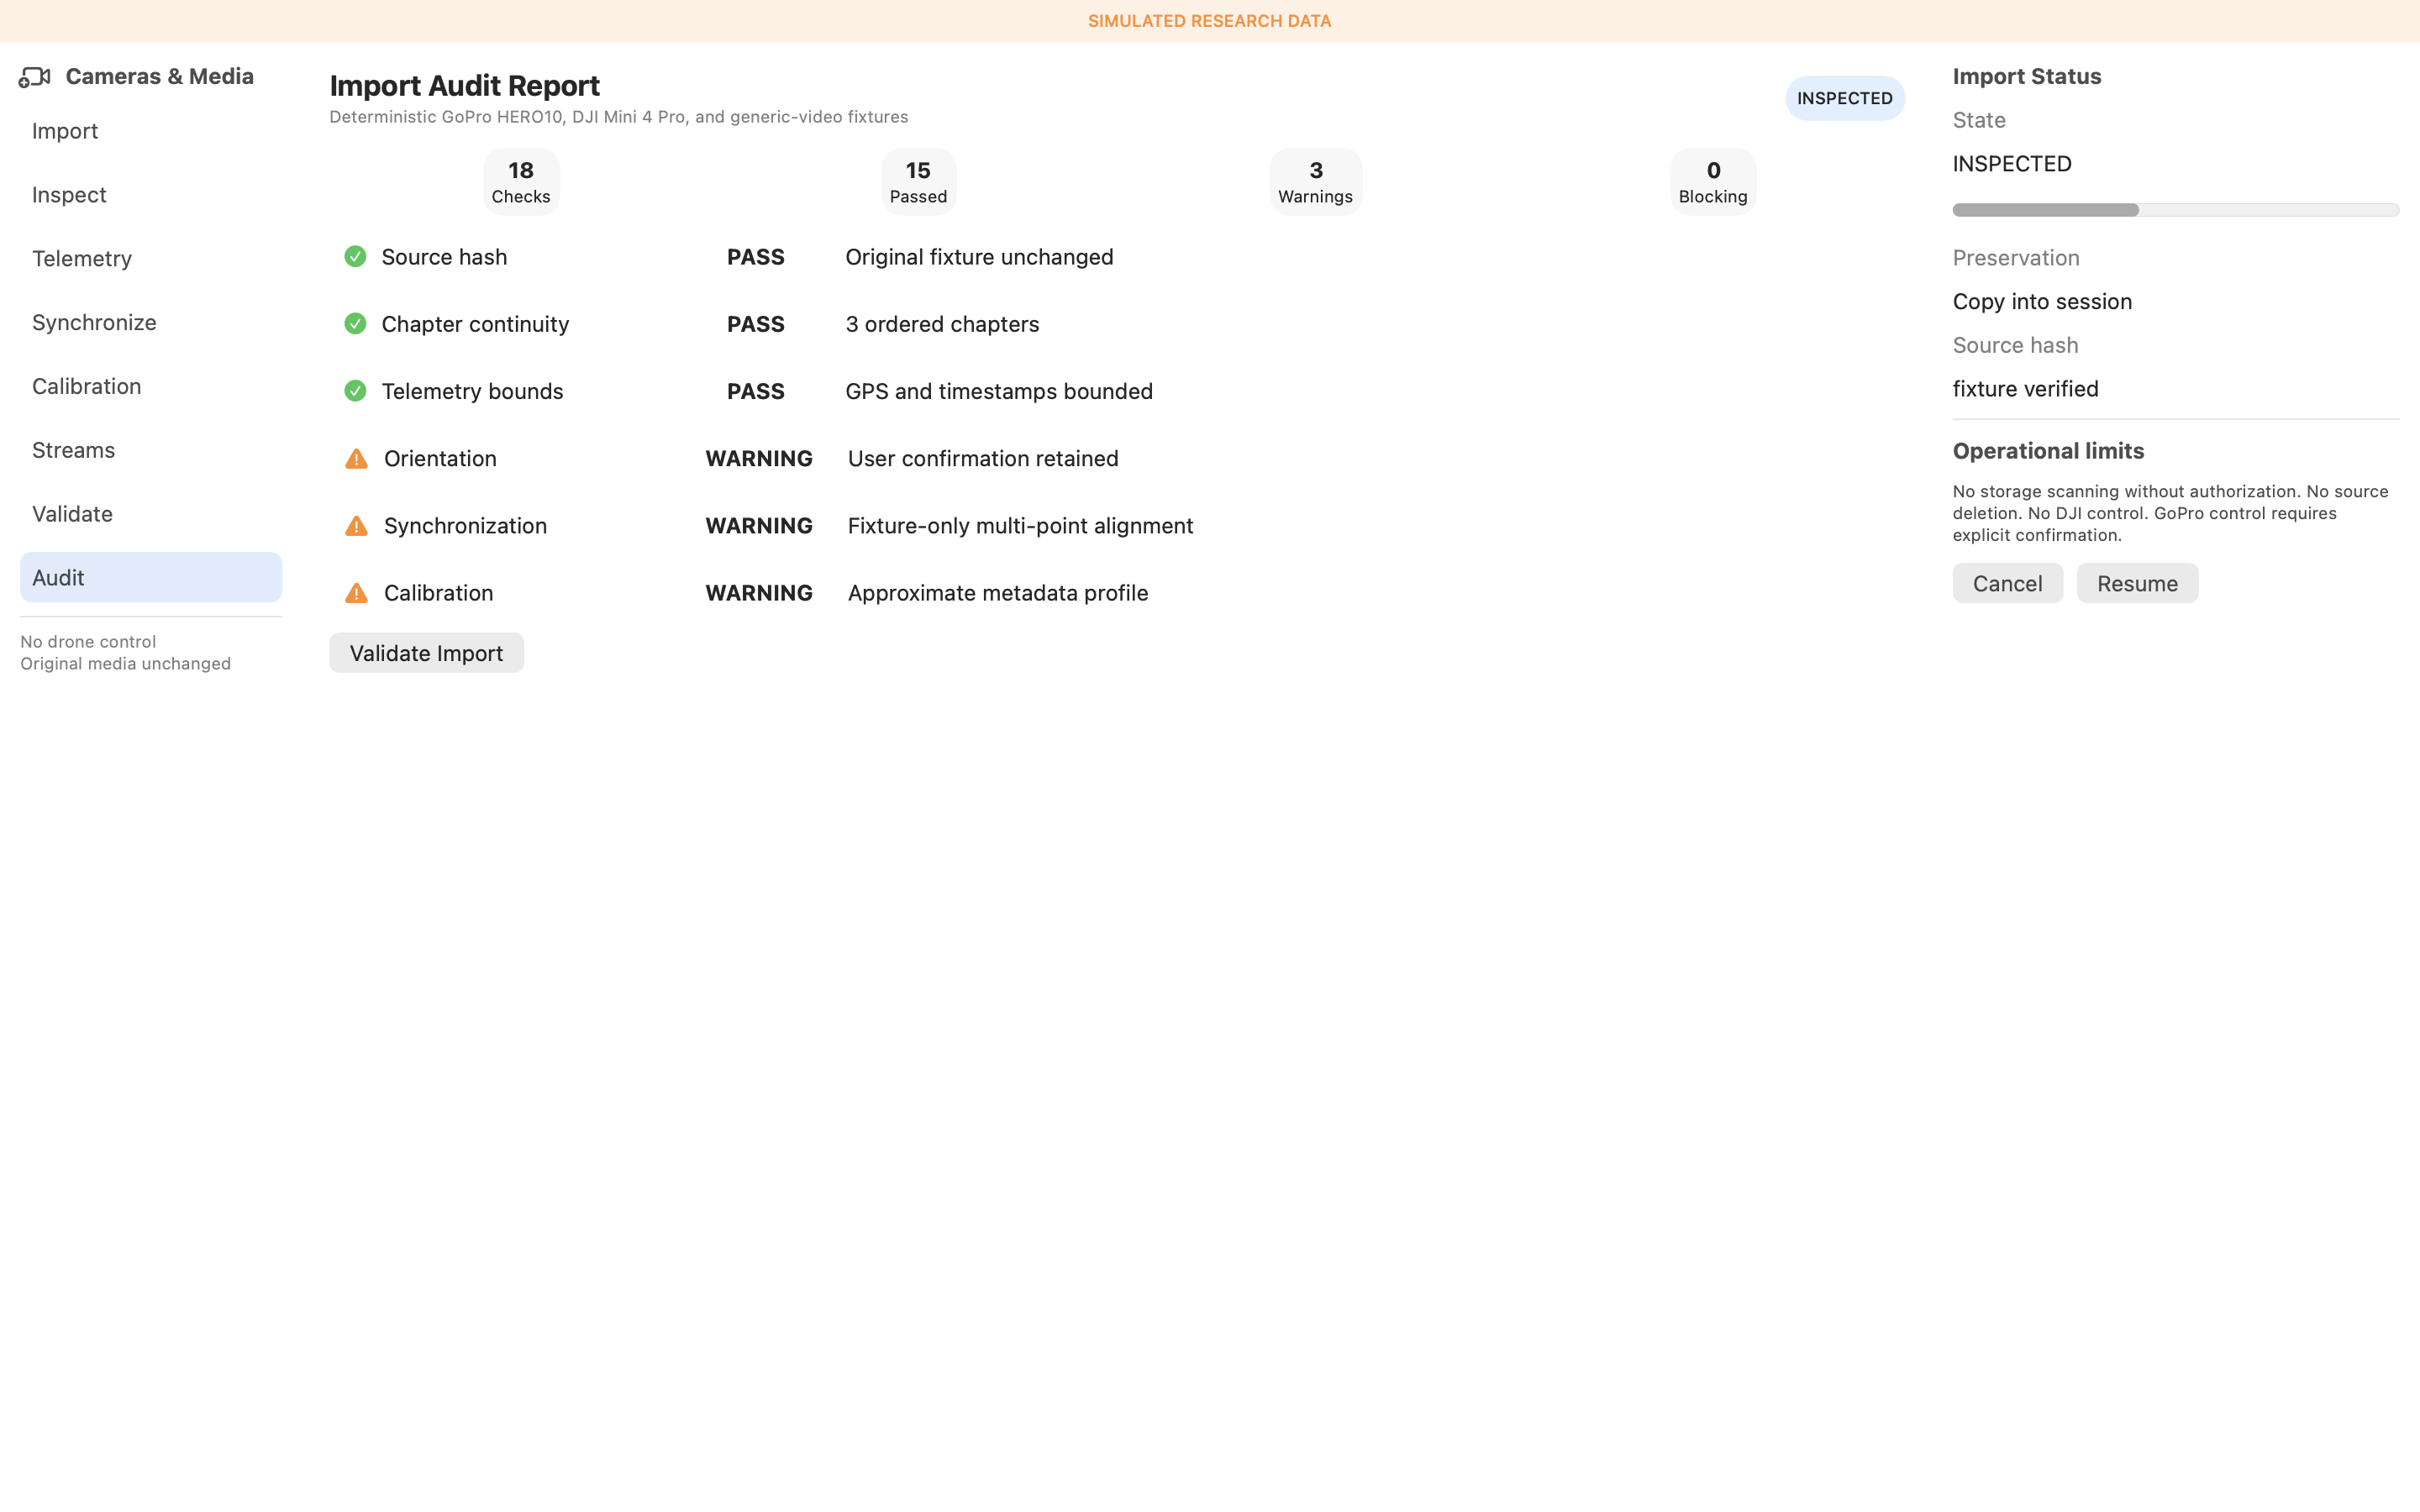
The external-import workspace guides authorized selection, inspection, GoPro chapters/GPMF, DJI sidecars, telemetry mapping, manual synchronization, calibration profiles, multi-camera playback, proxy generation, and validation/audit. iPhone shows compact transfer and warning status. All images below use deterministic fixtures.
Phase 9 research experiments
The iPad and macOS Research workspace provides experiment browsing and building, confusion matrices, feature ablation, error analysis, neutral comparison, summaries, reproducibility, feature tables, threshold and calibration views, generated reports, and cache management. iPhone supplies a lightweight monitor. All examples are deterministic simulated data, not evidence of field performance.
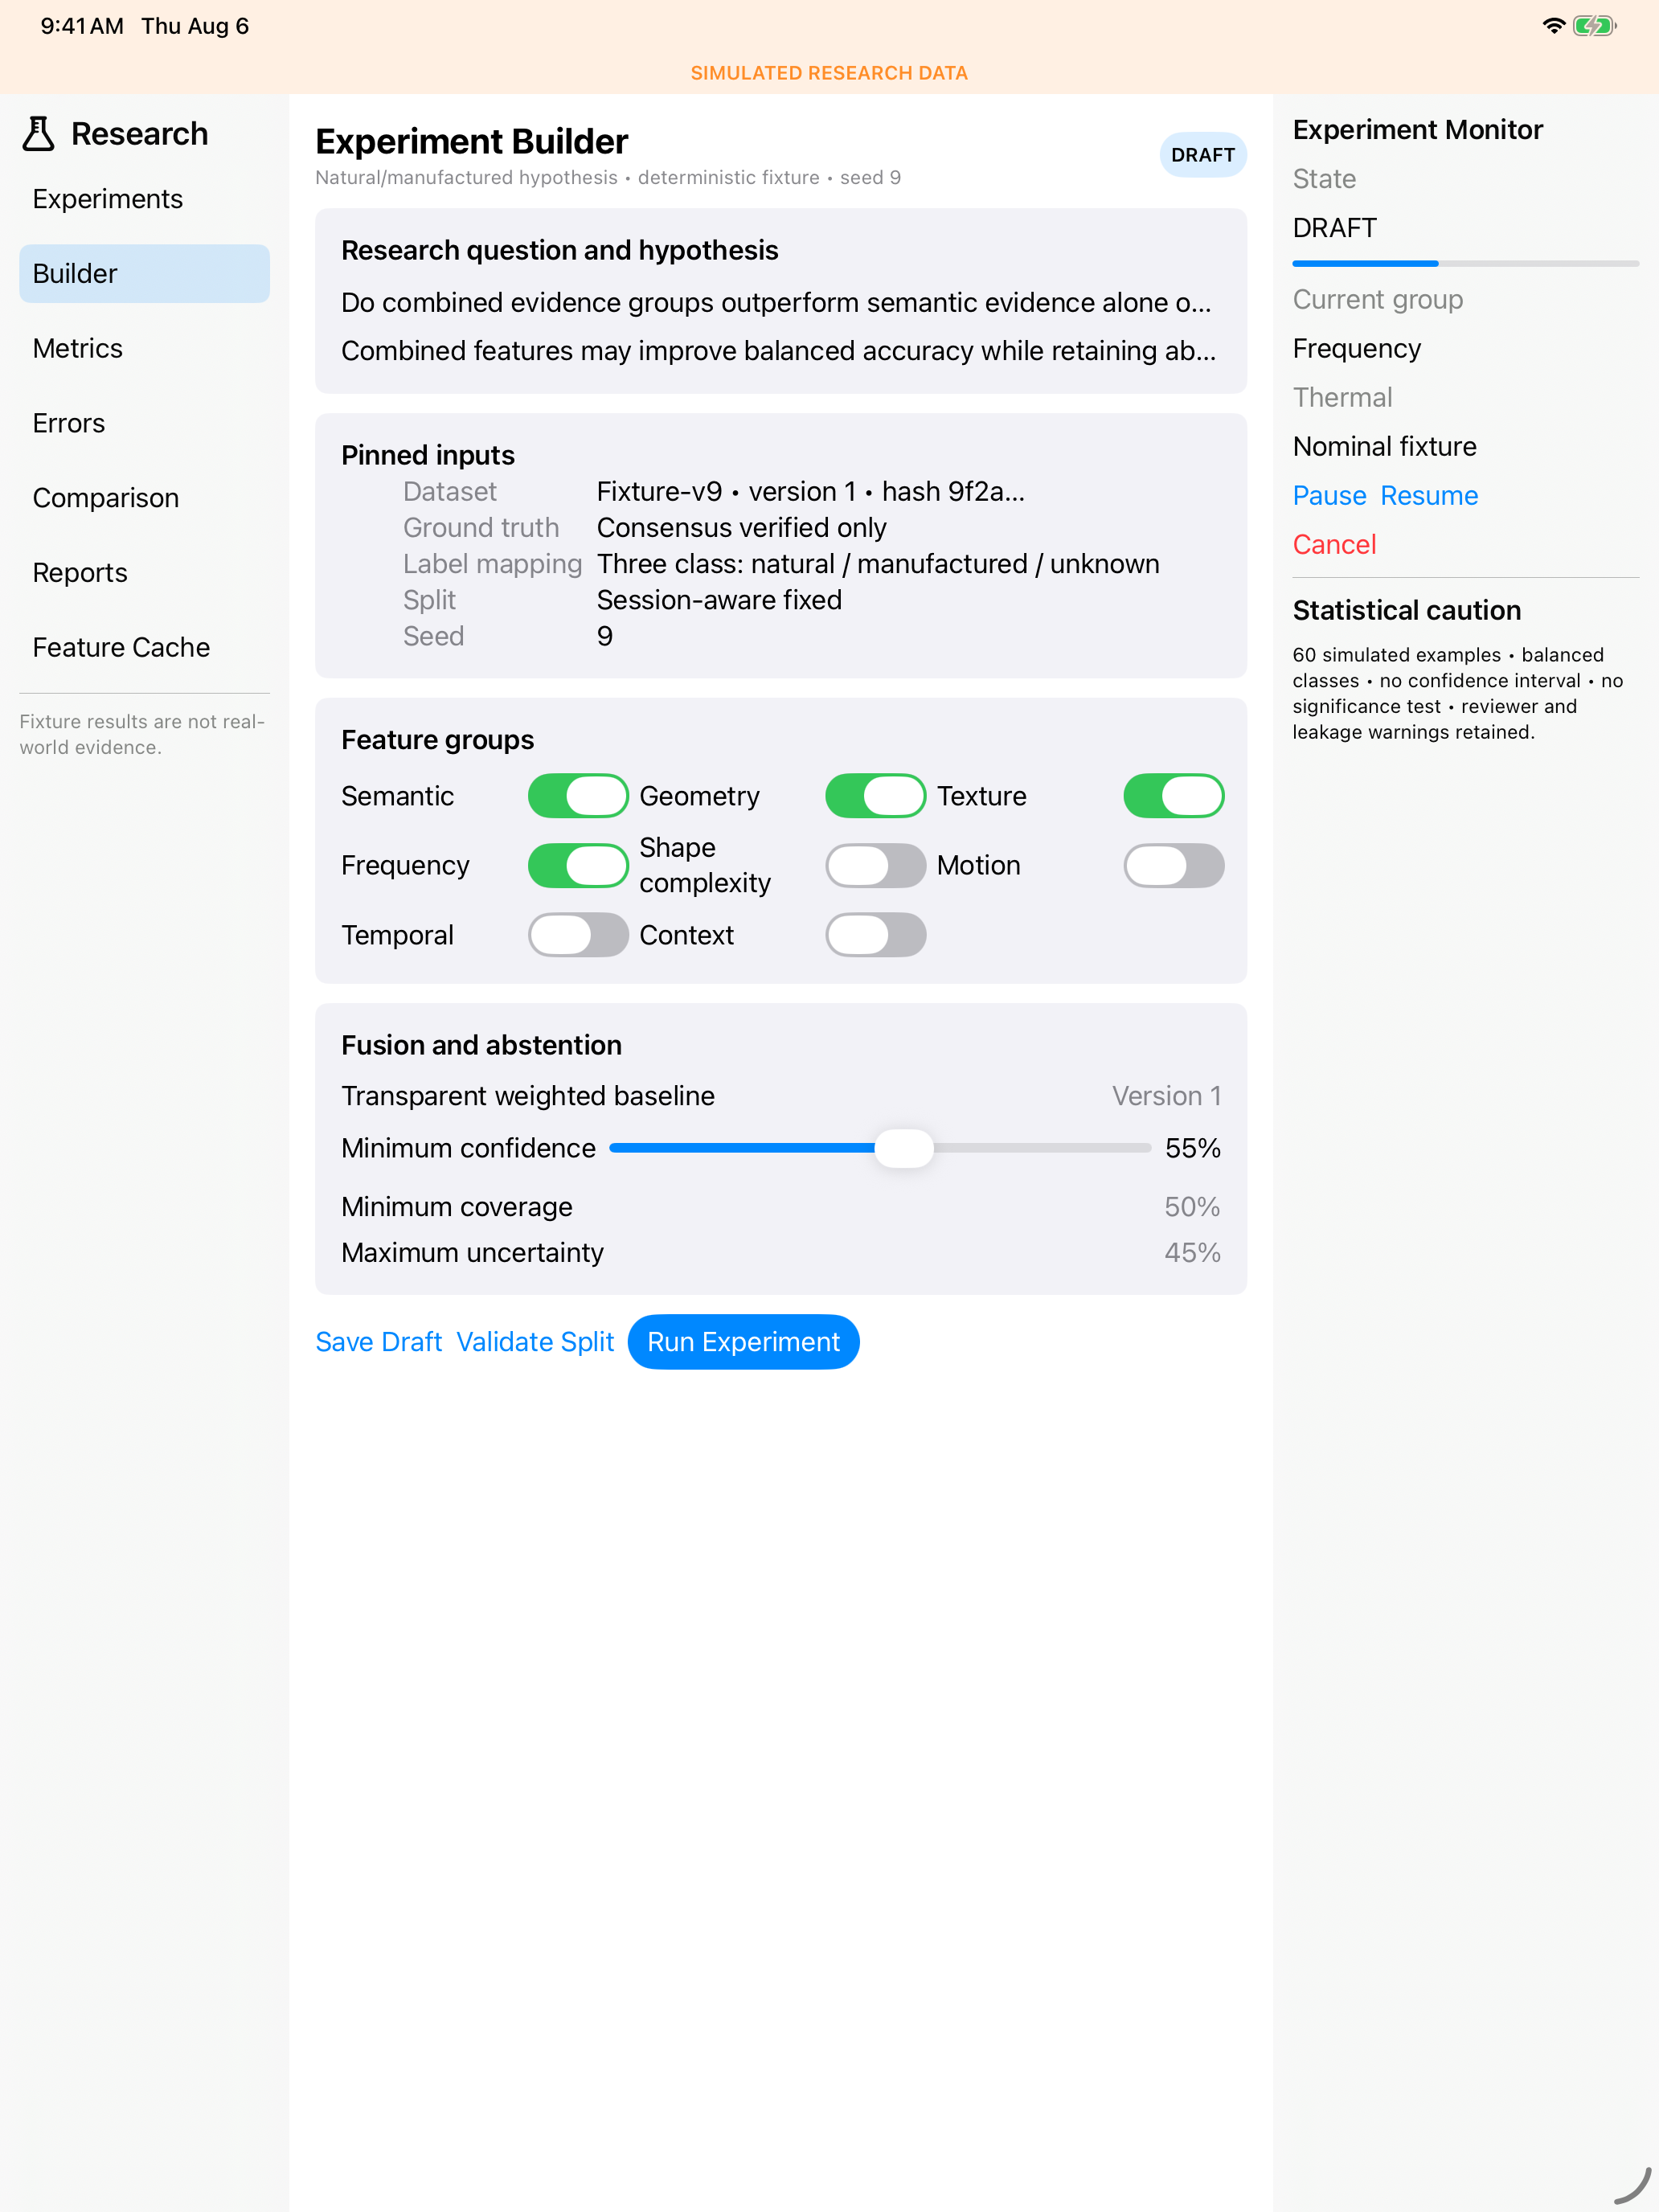
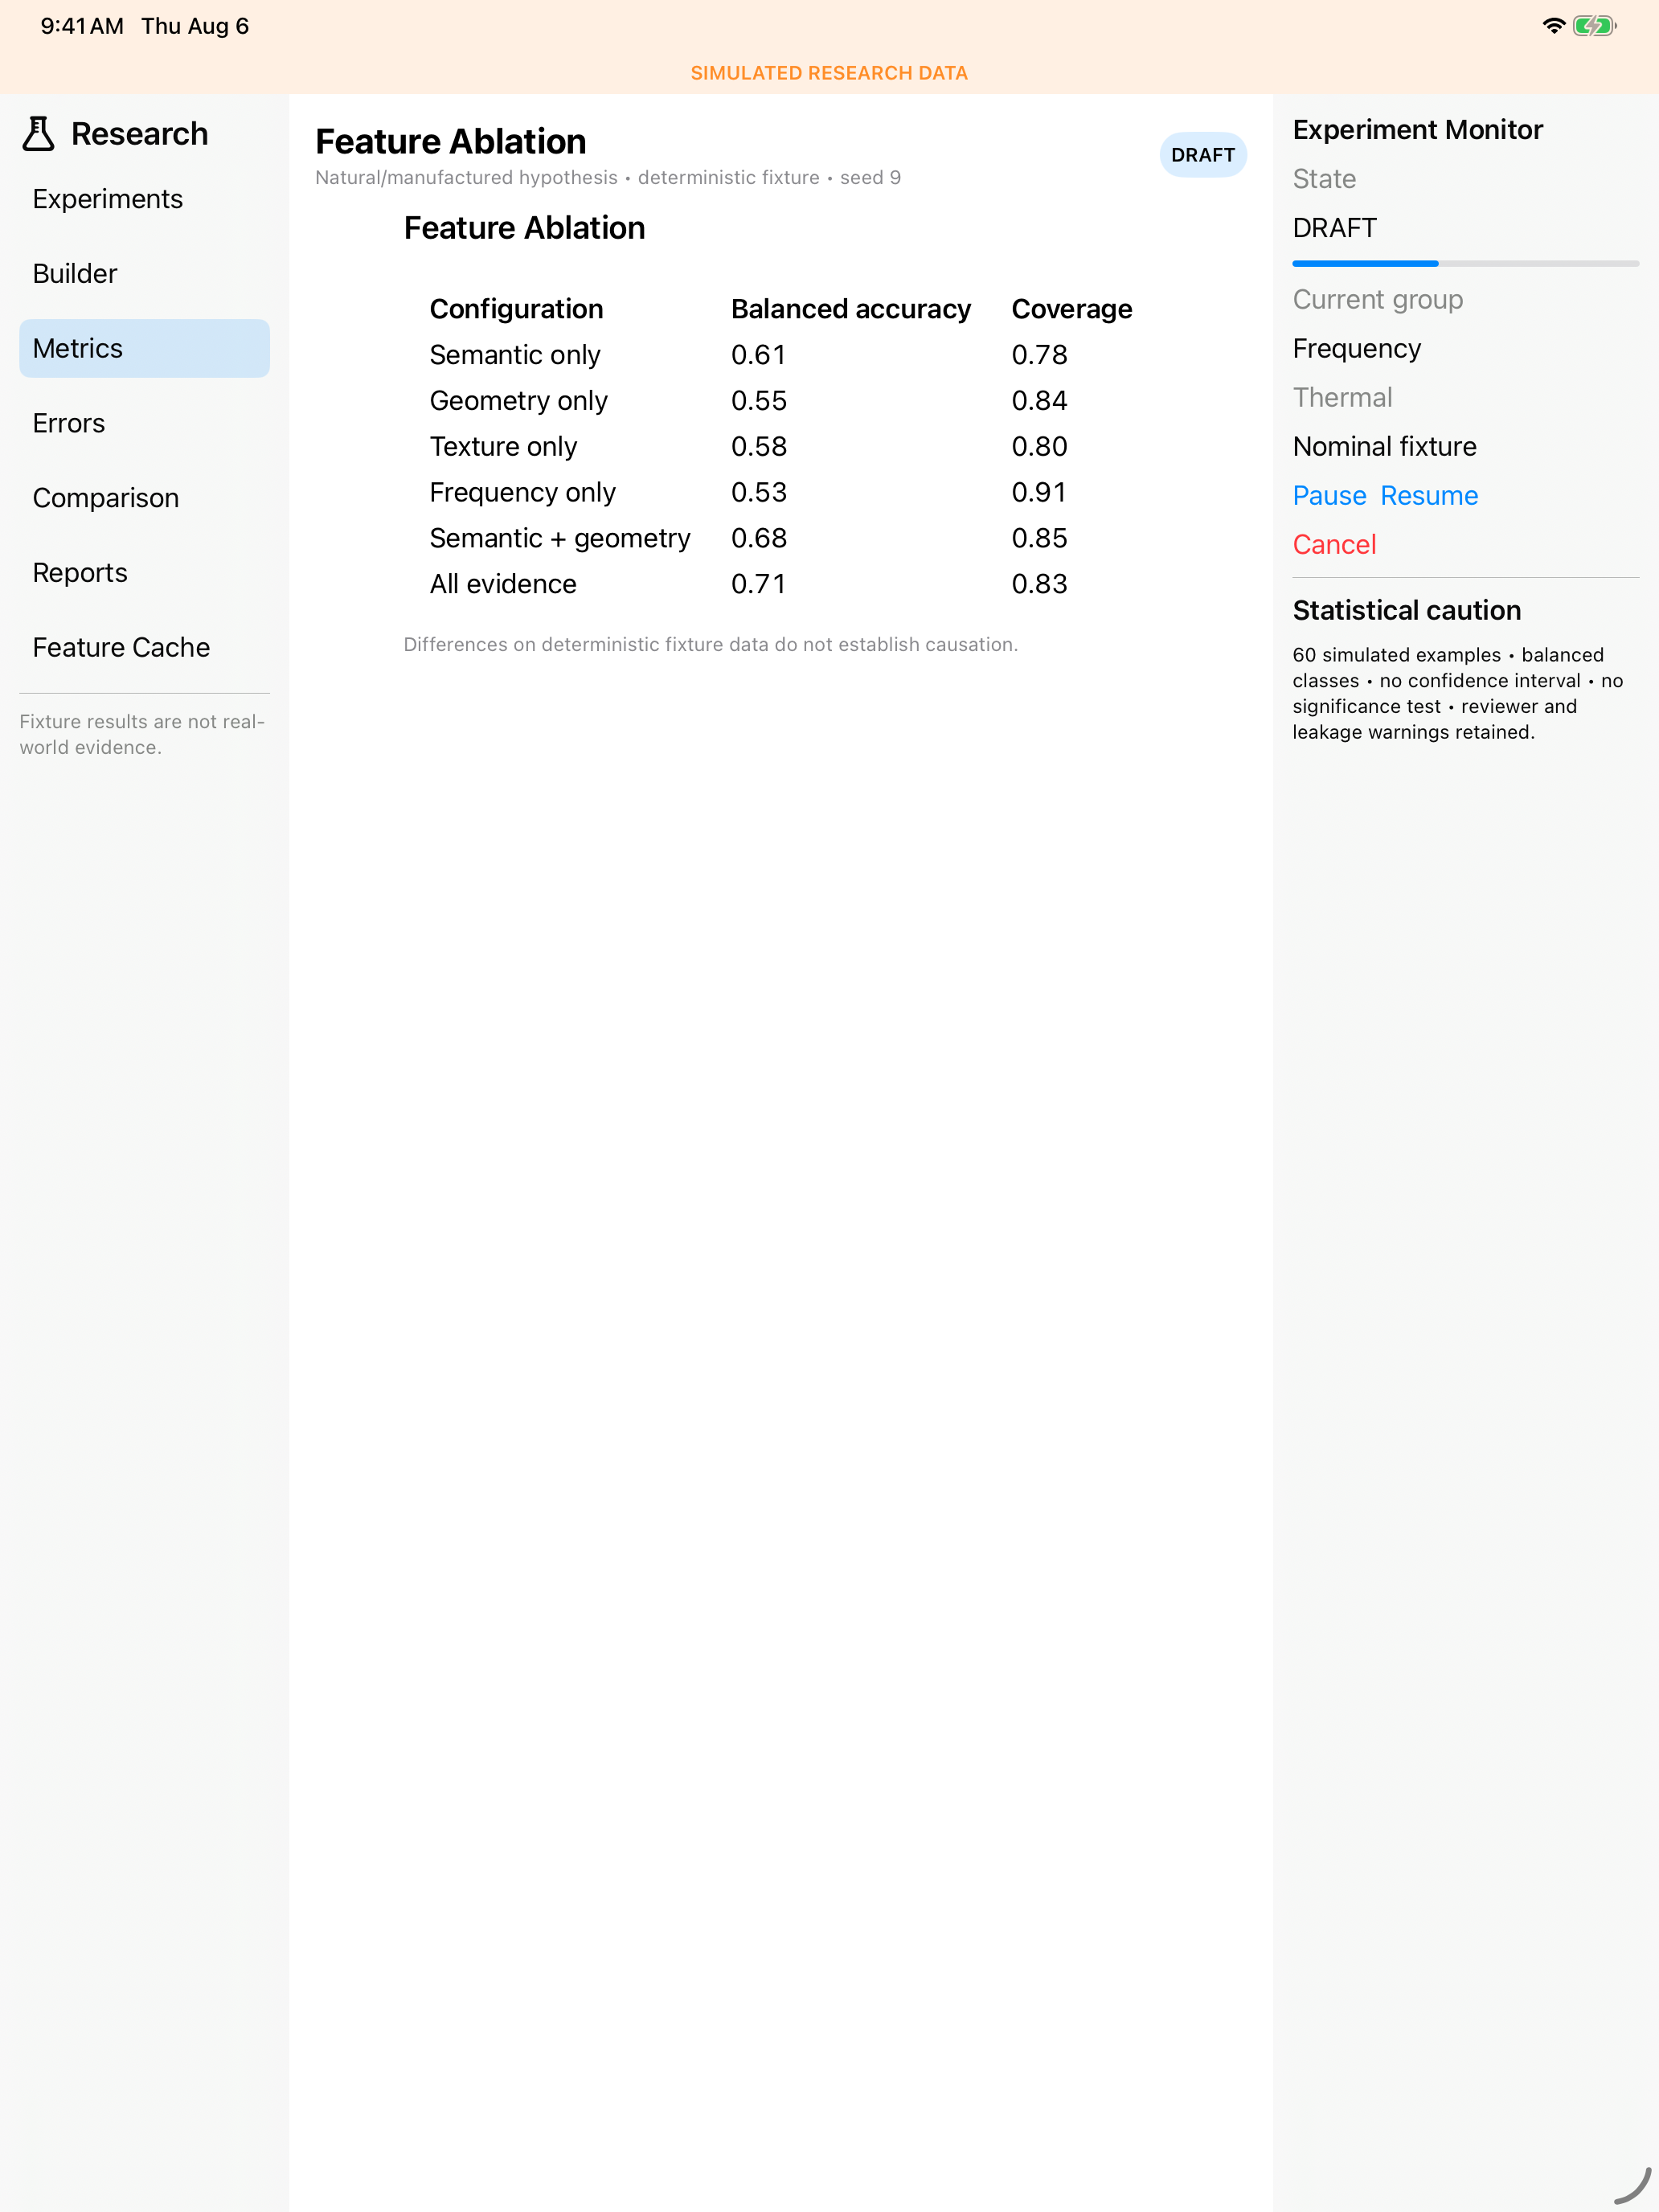
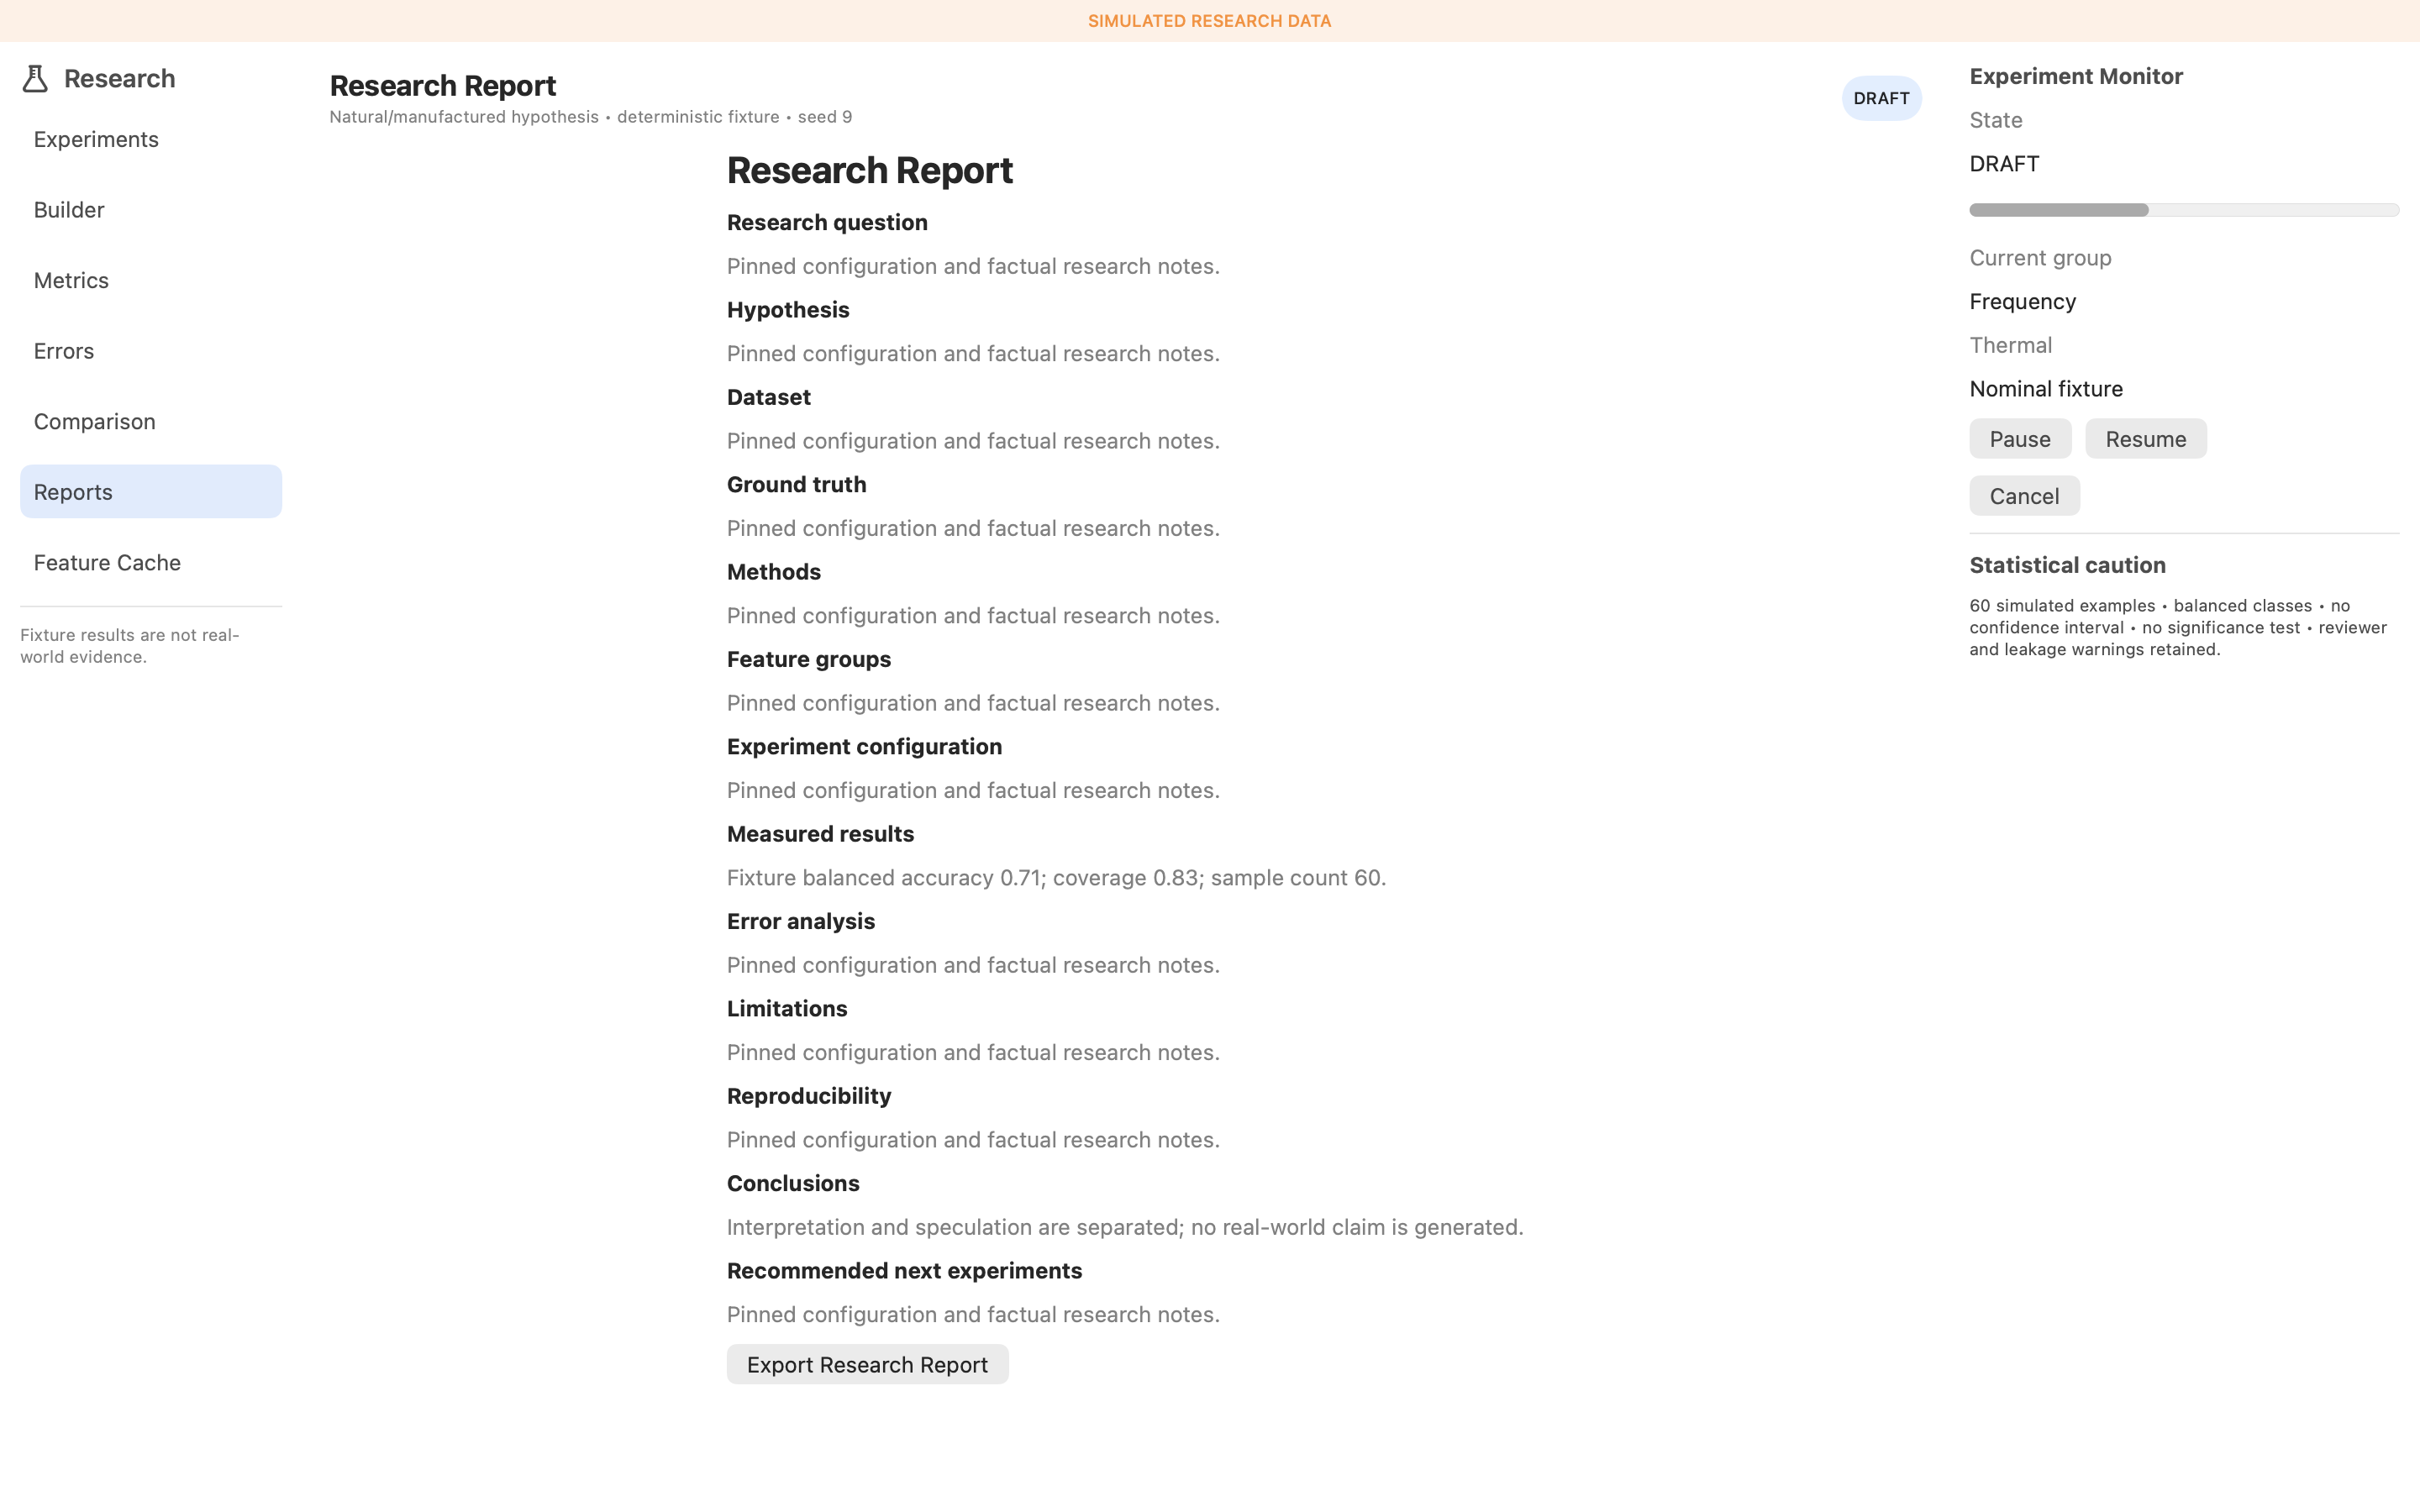
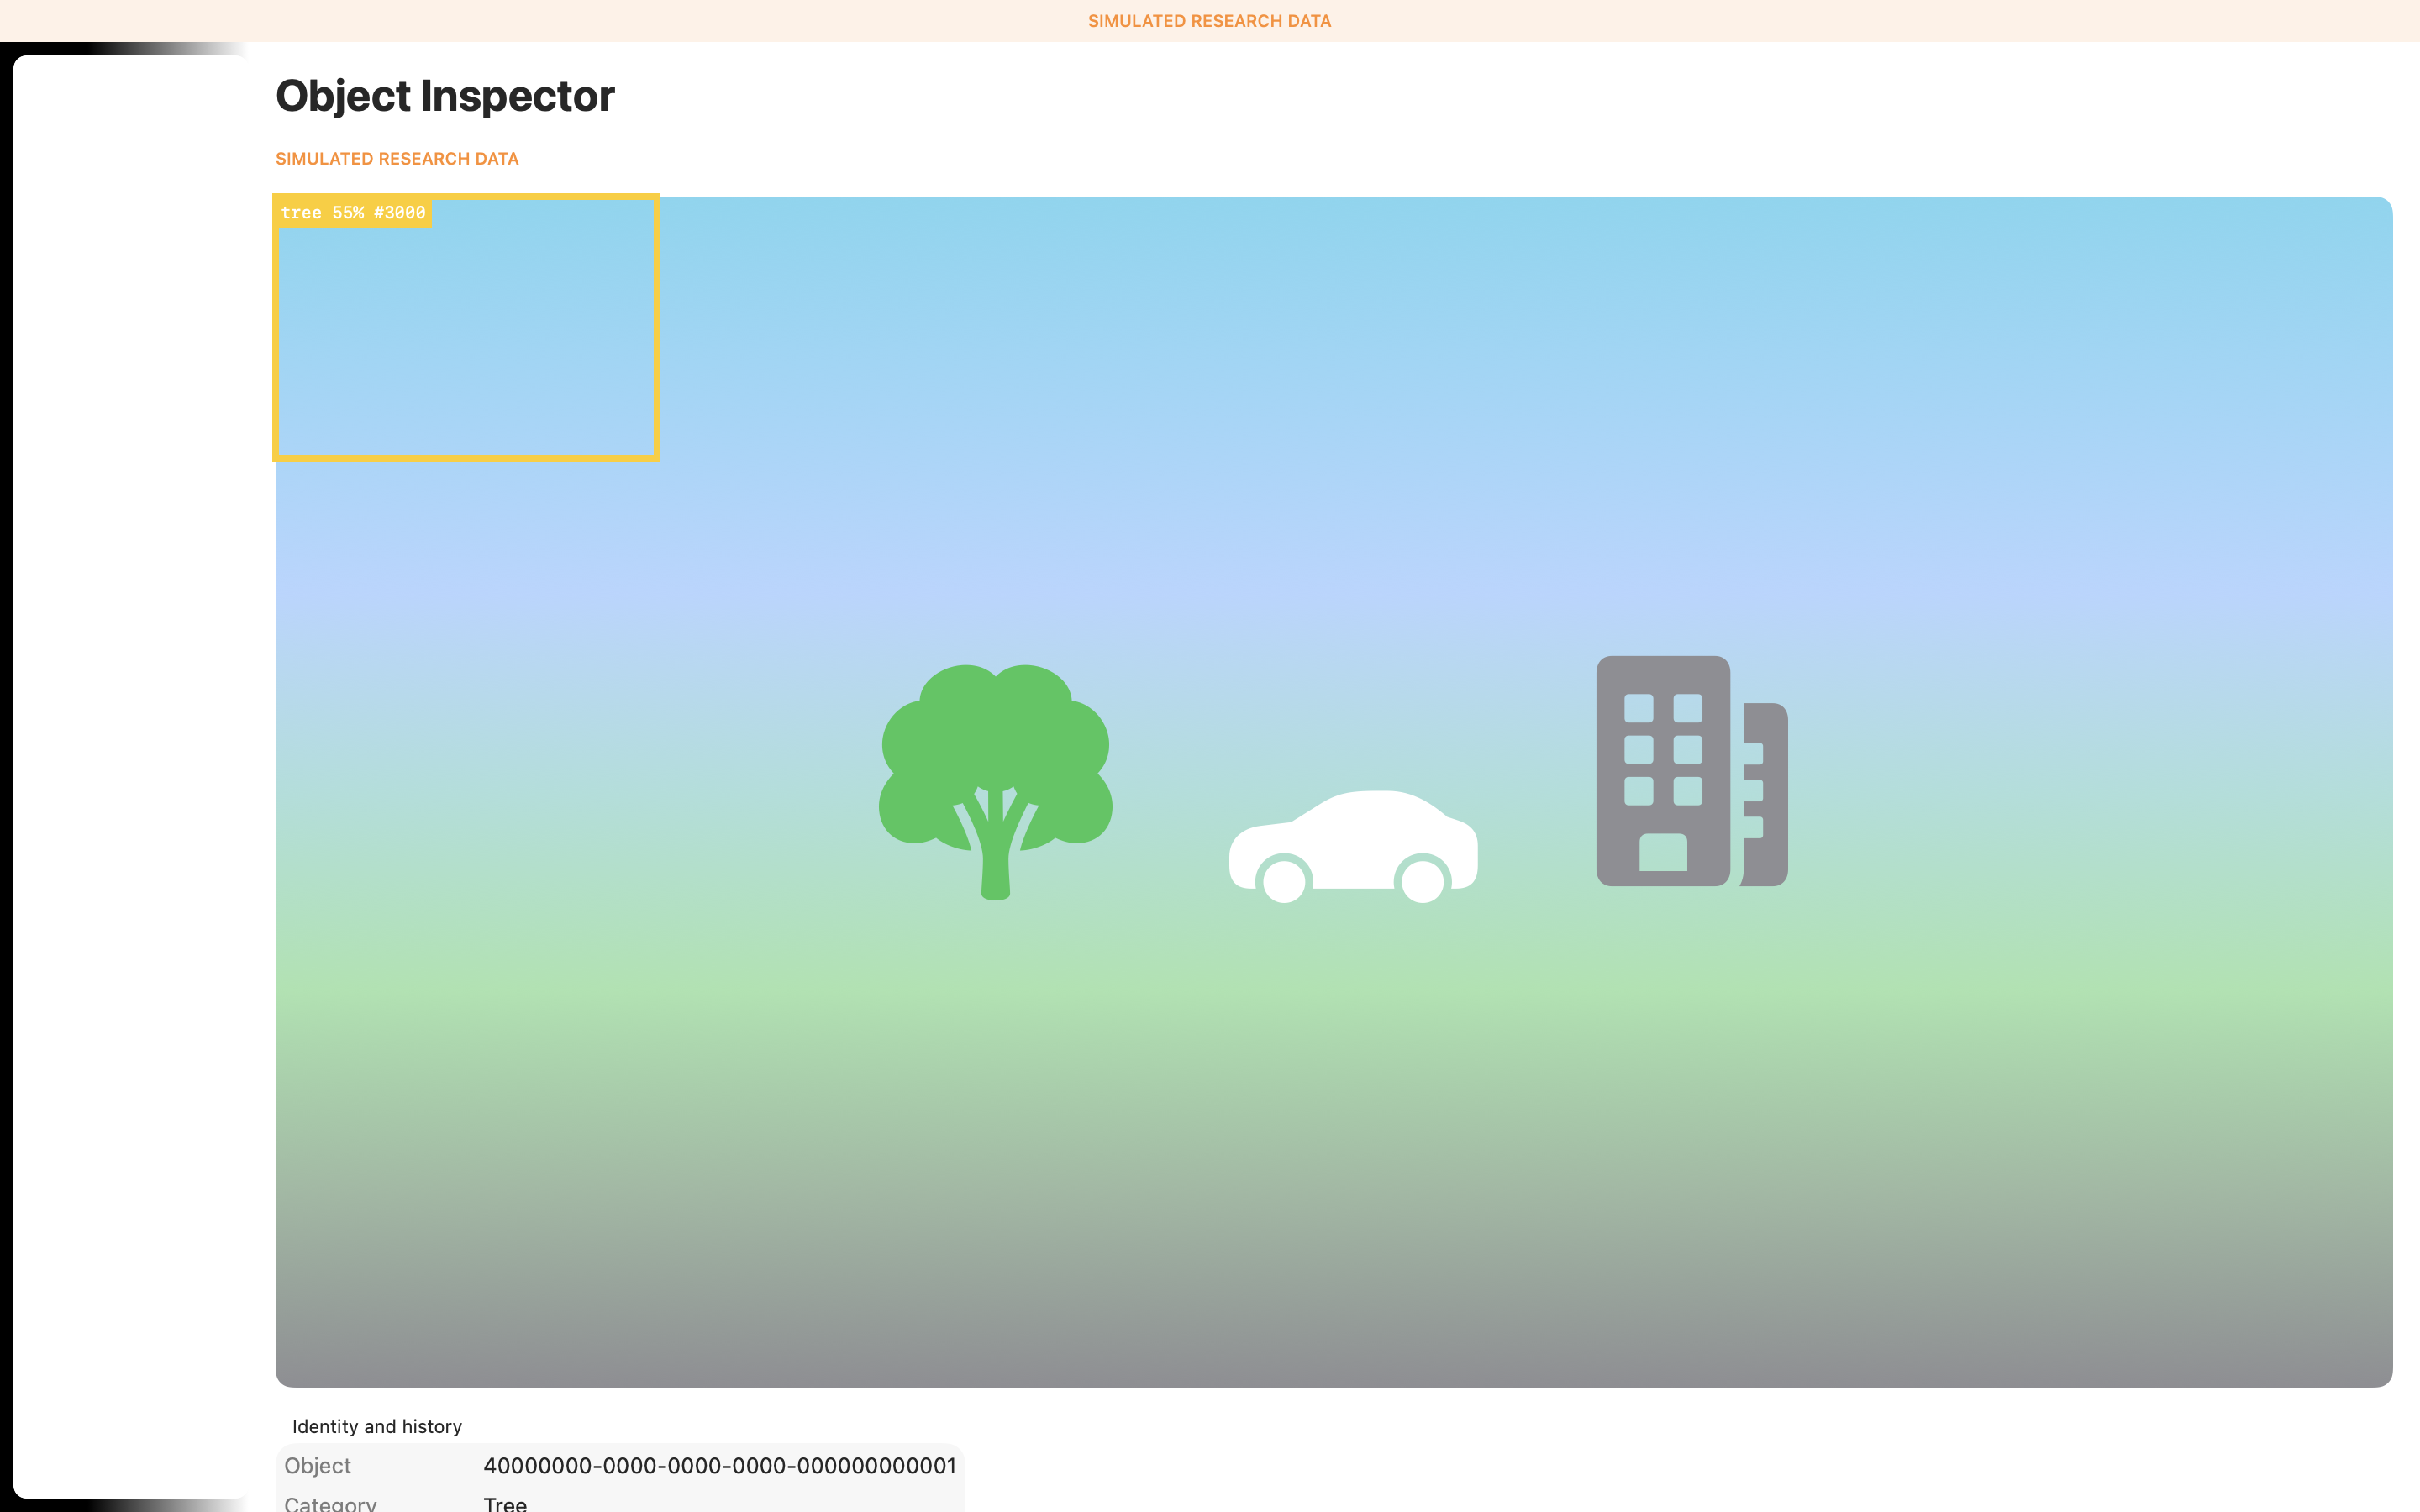
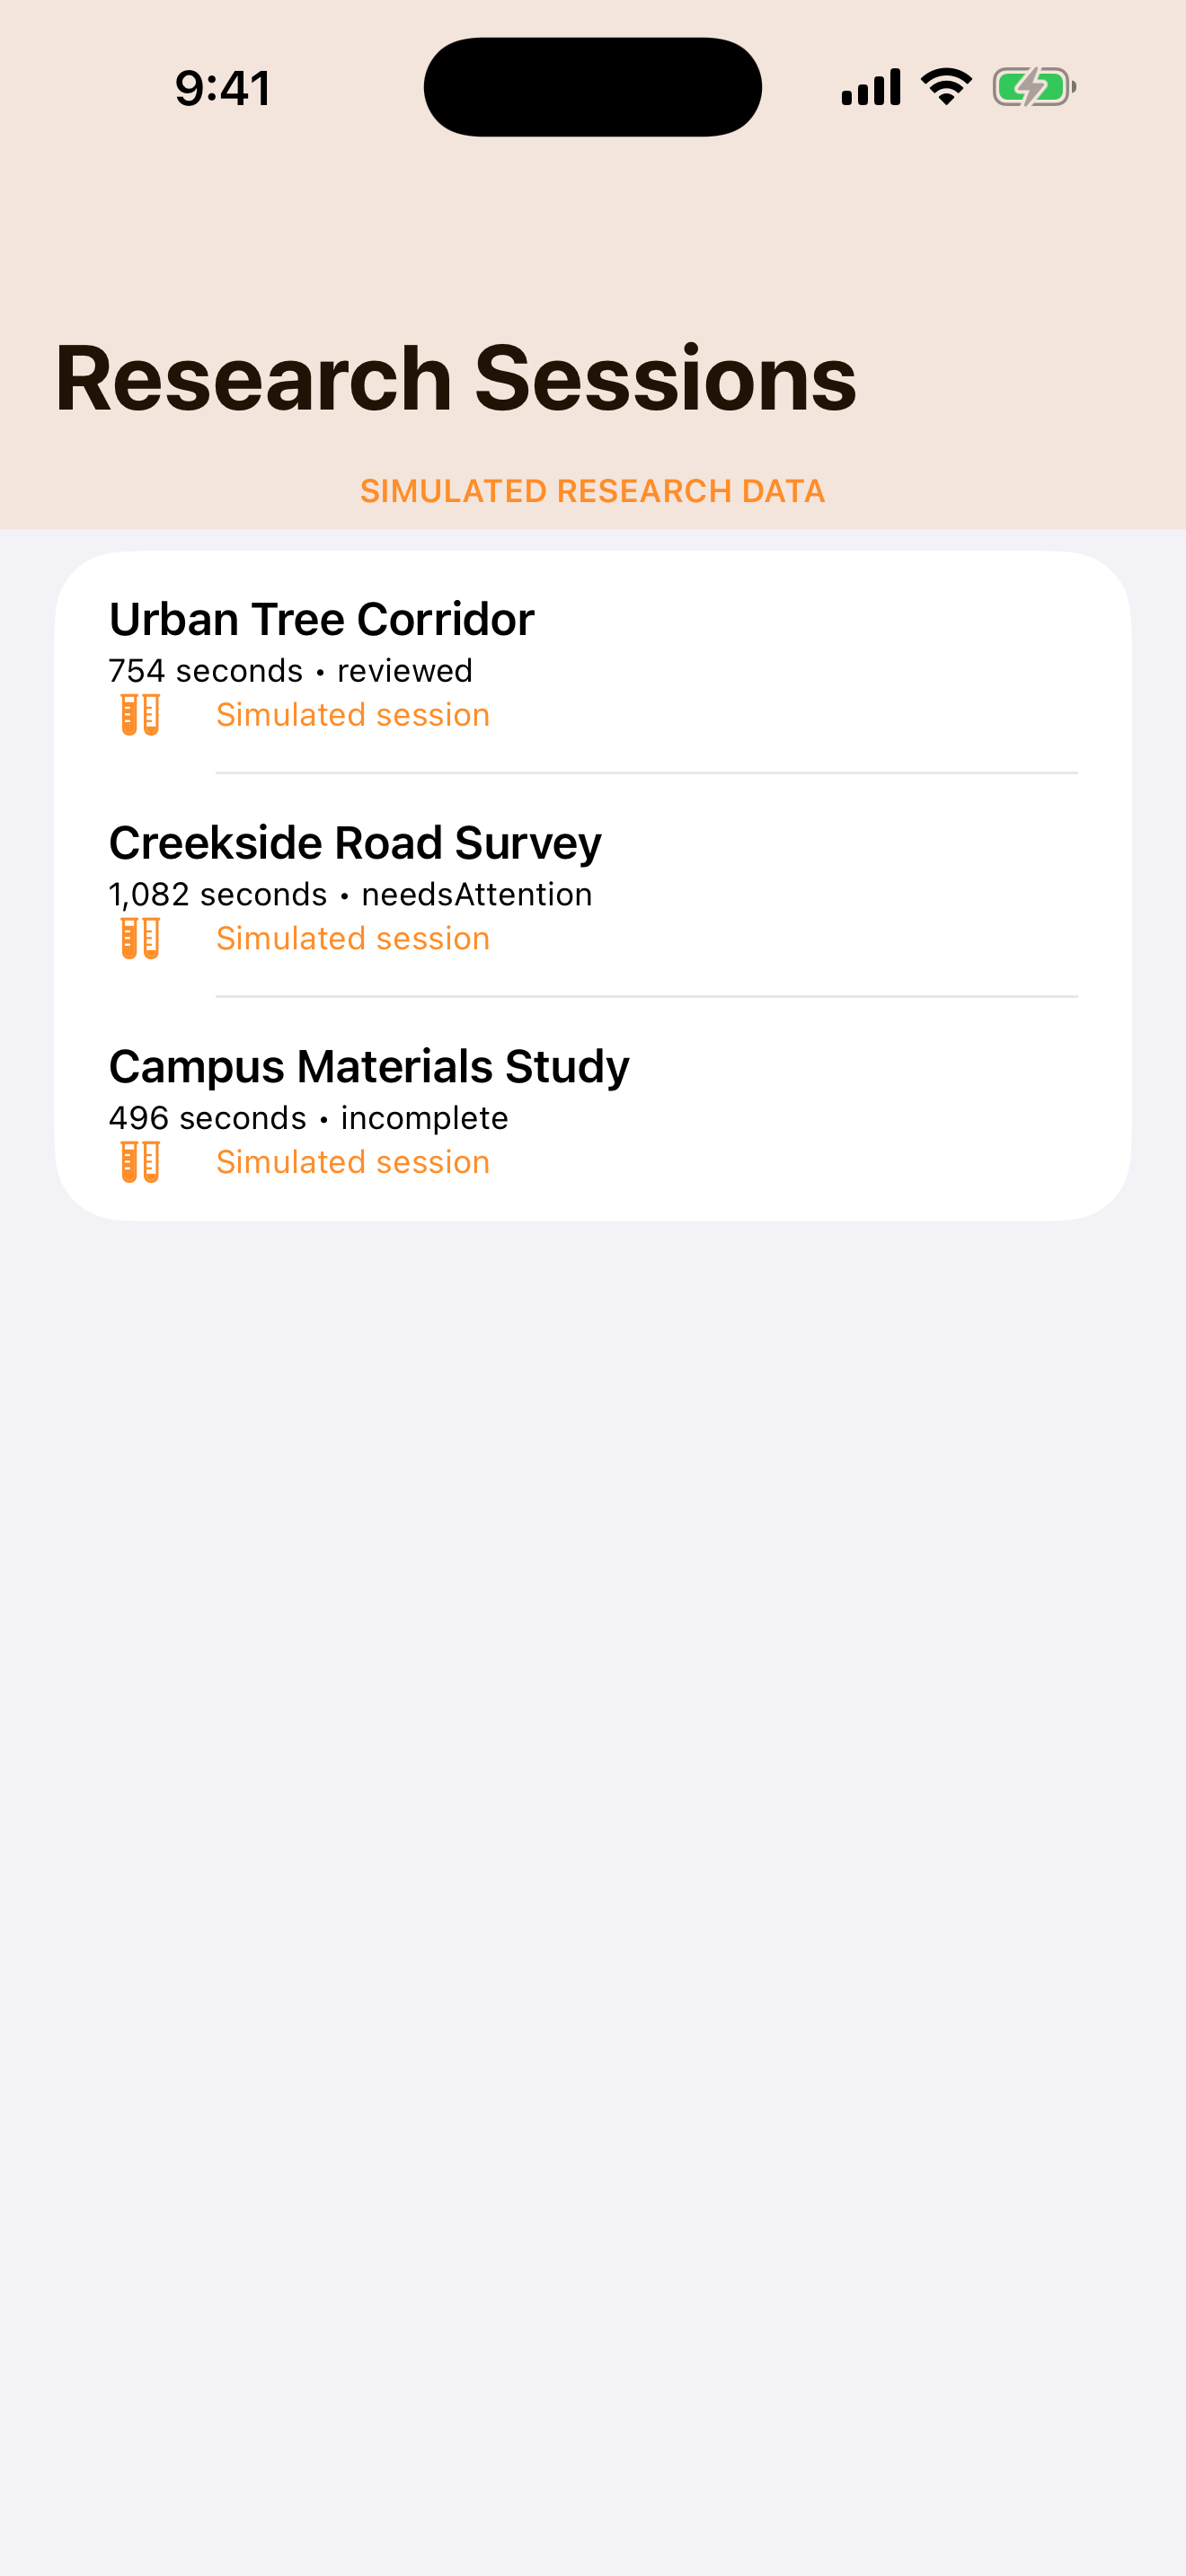
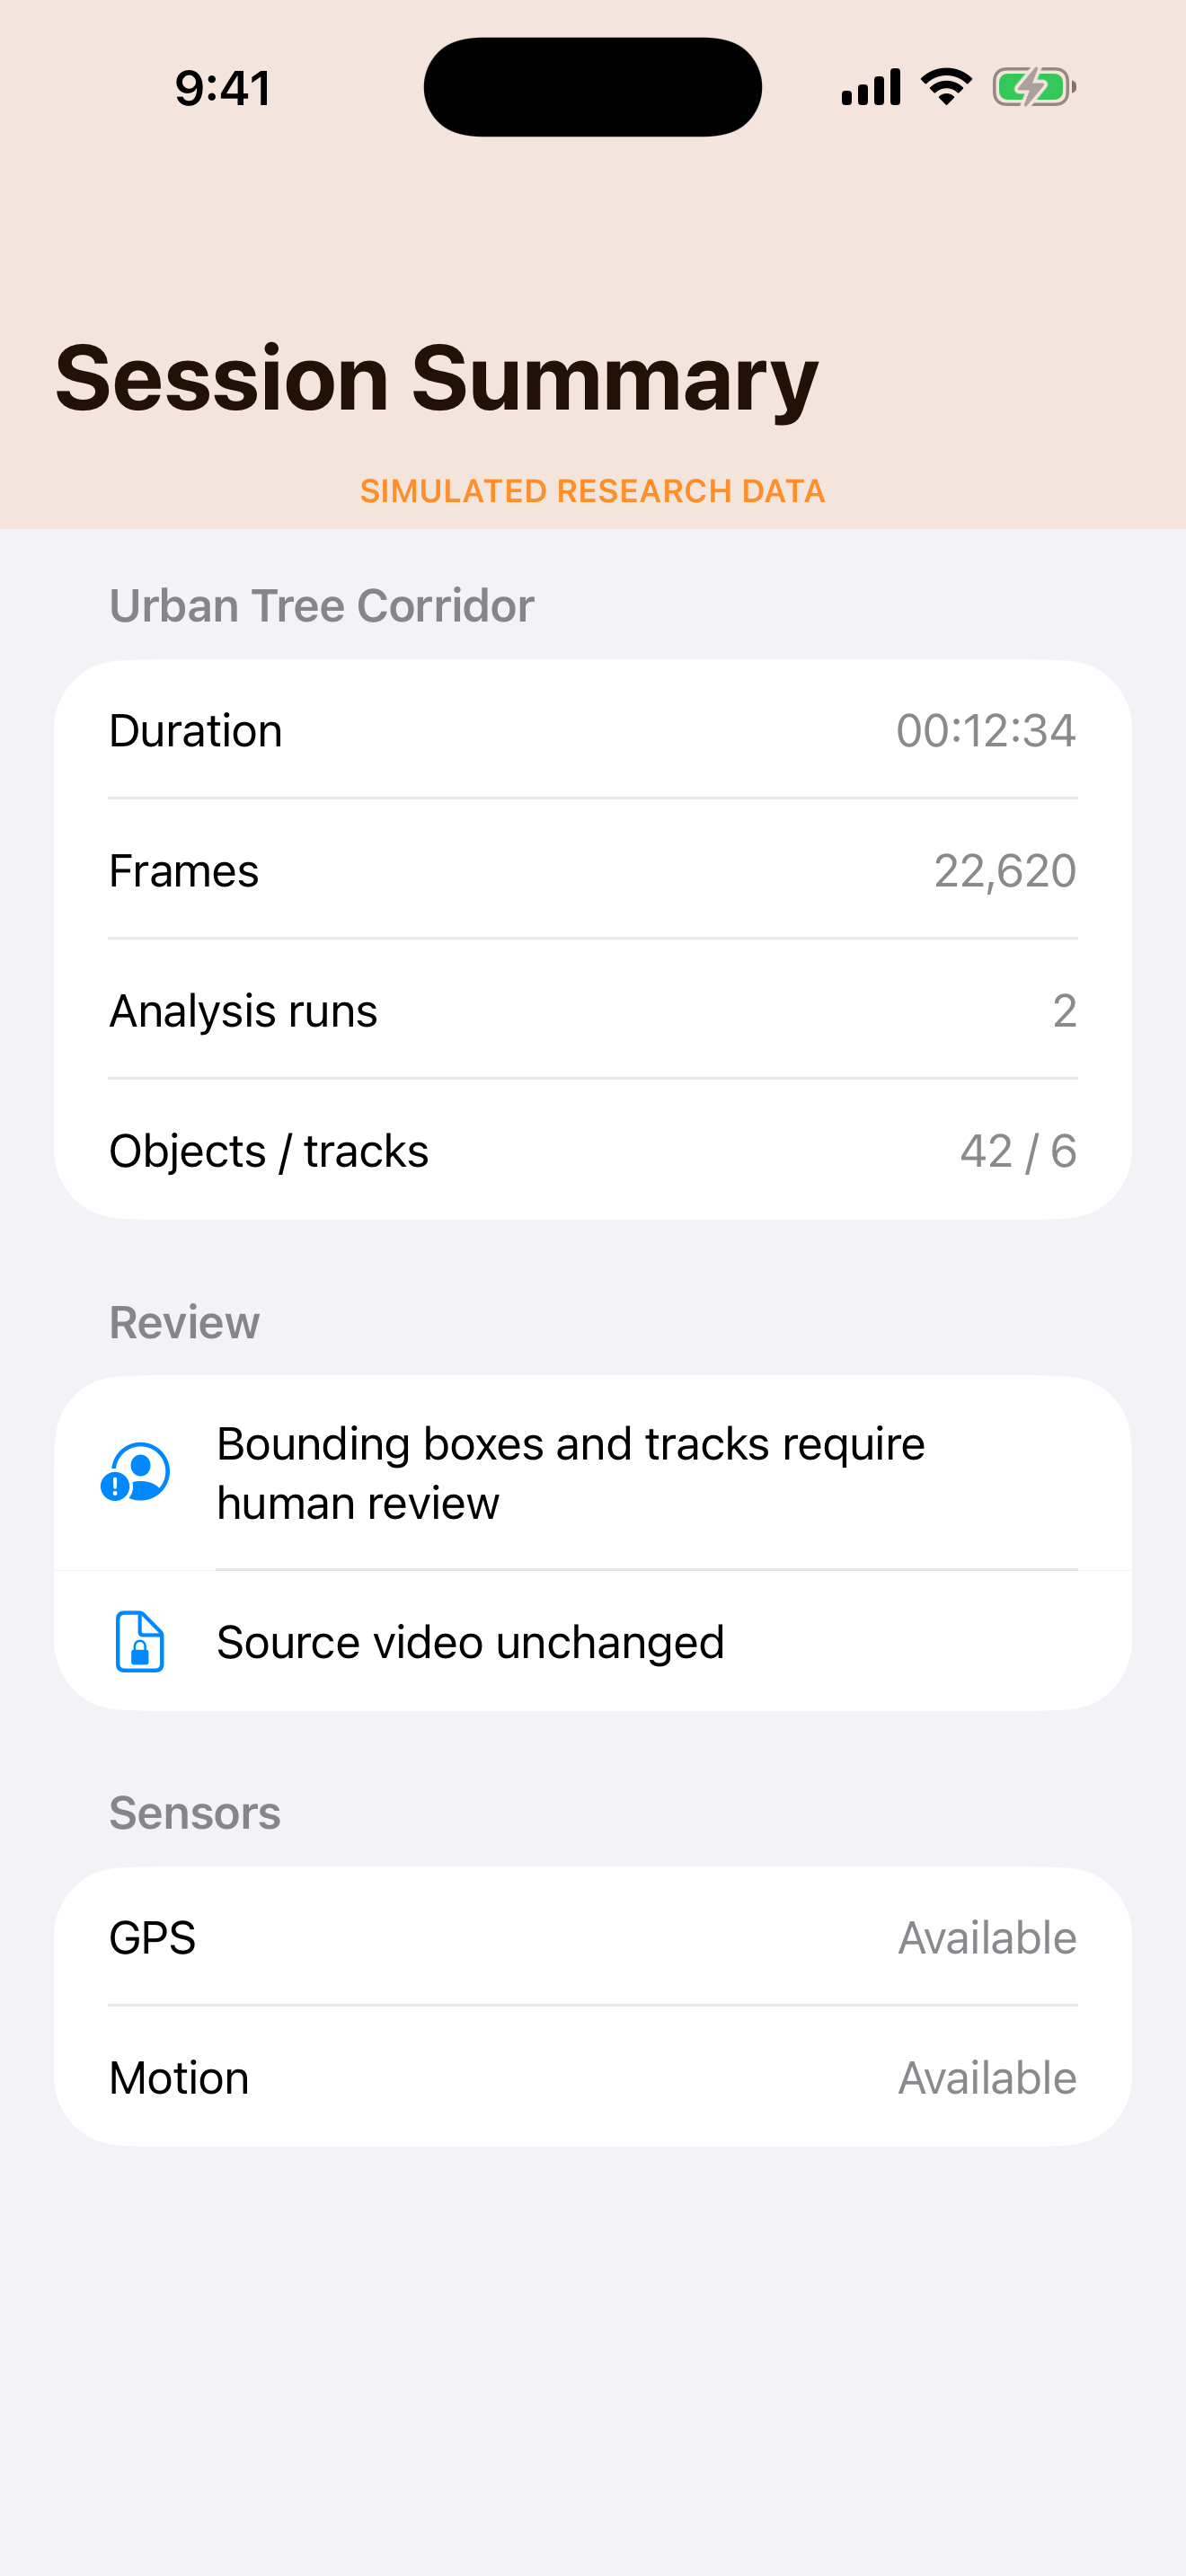
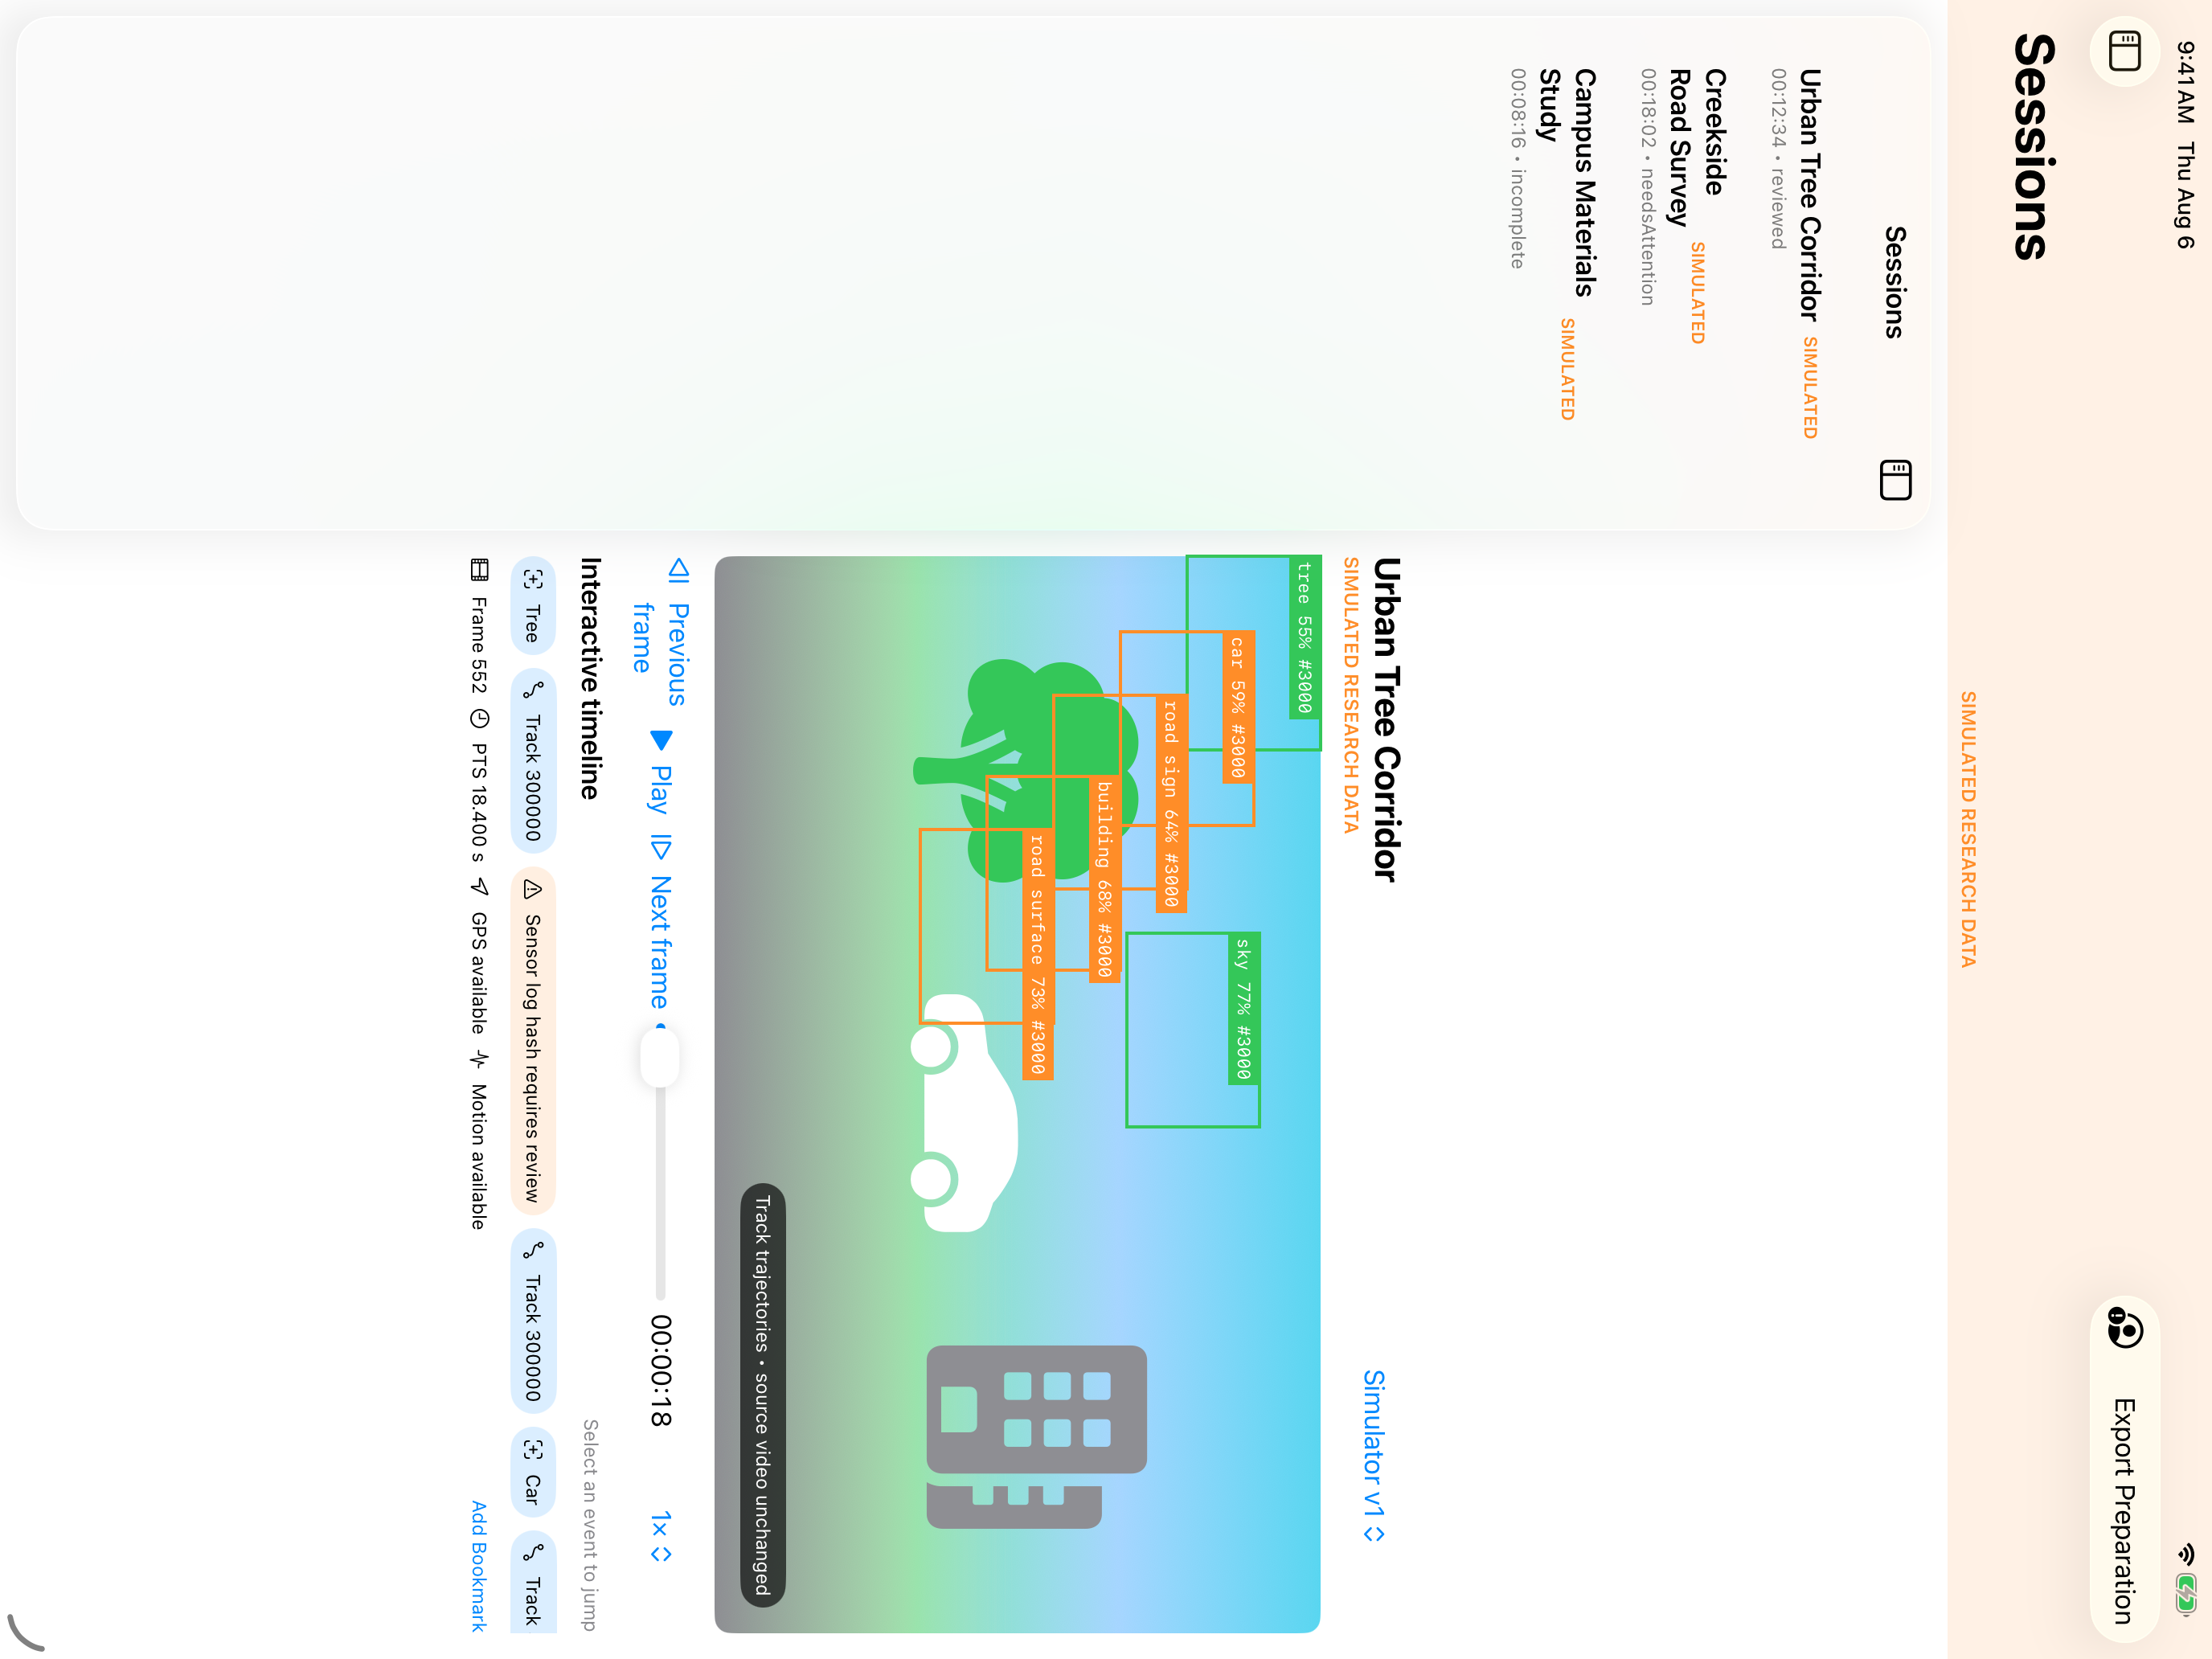
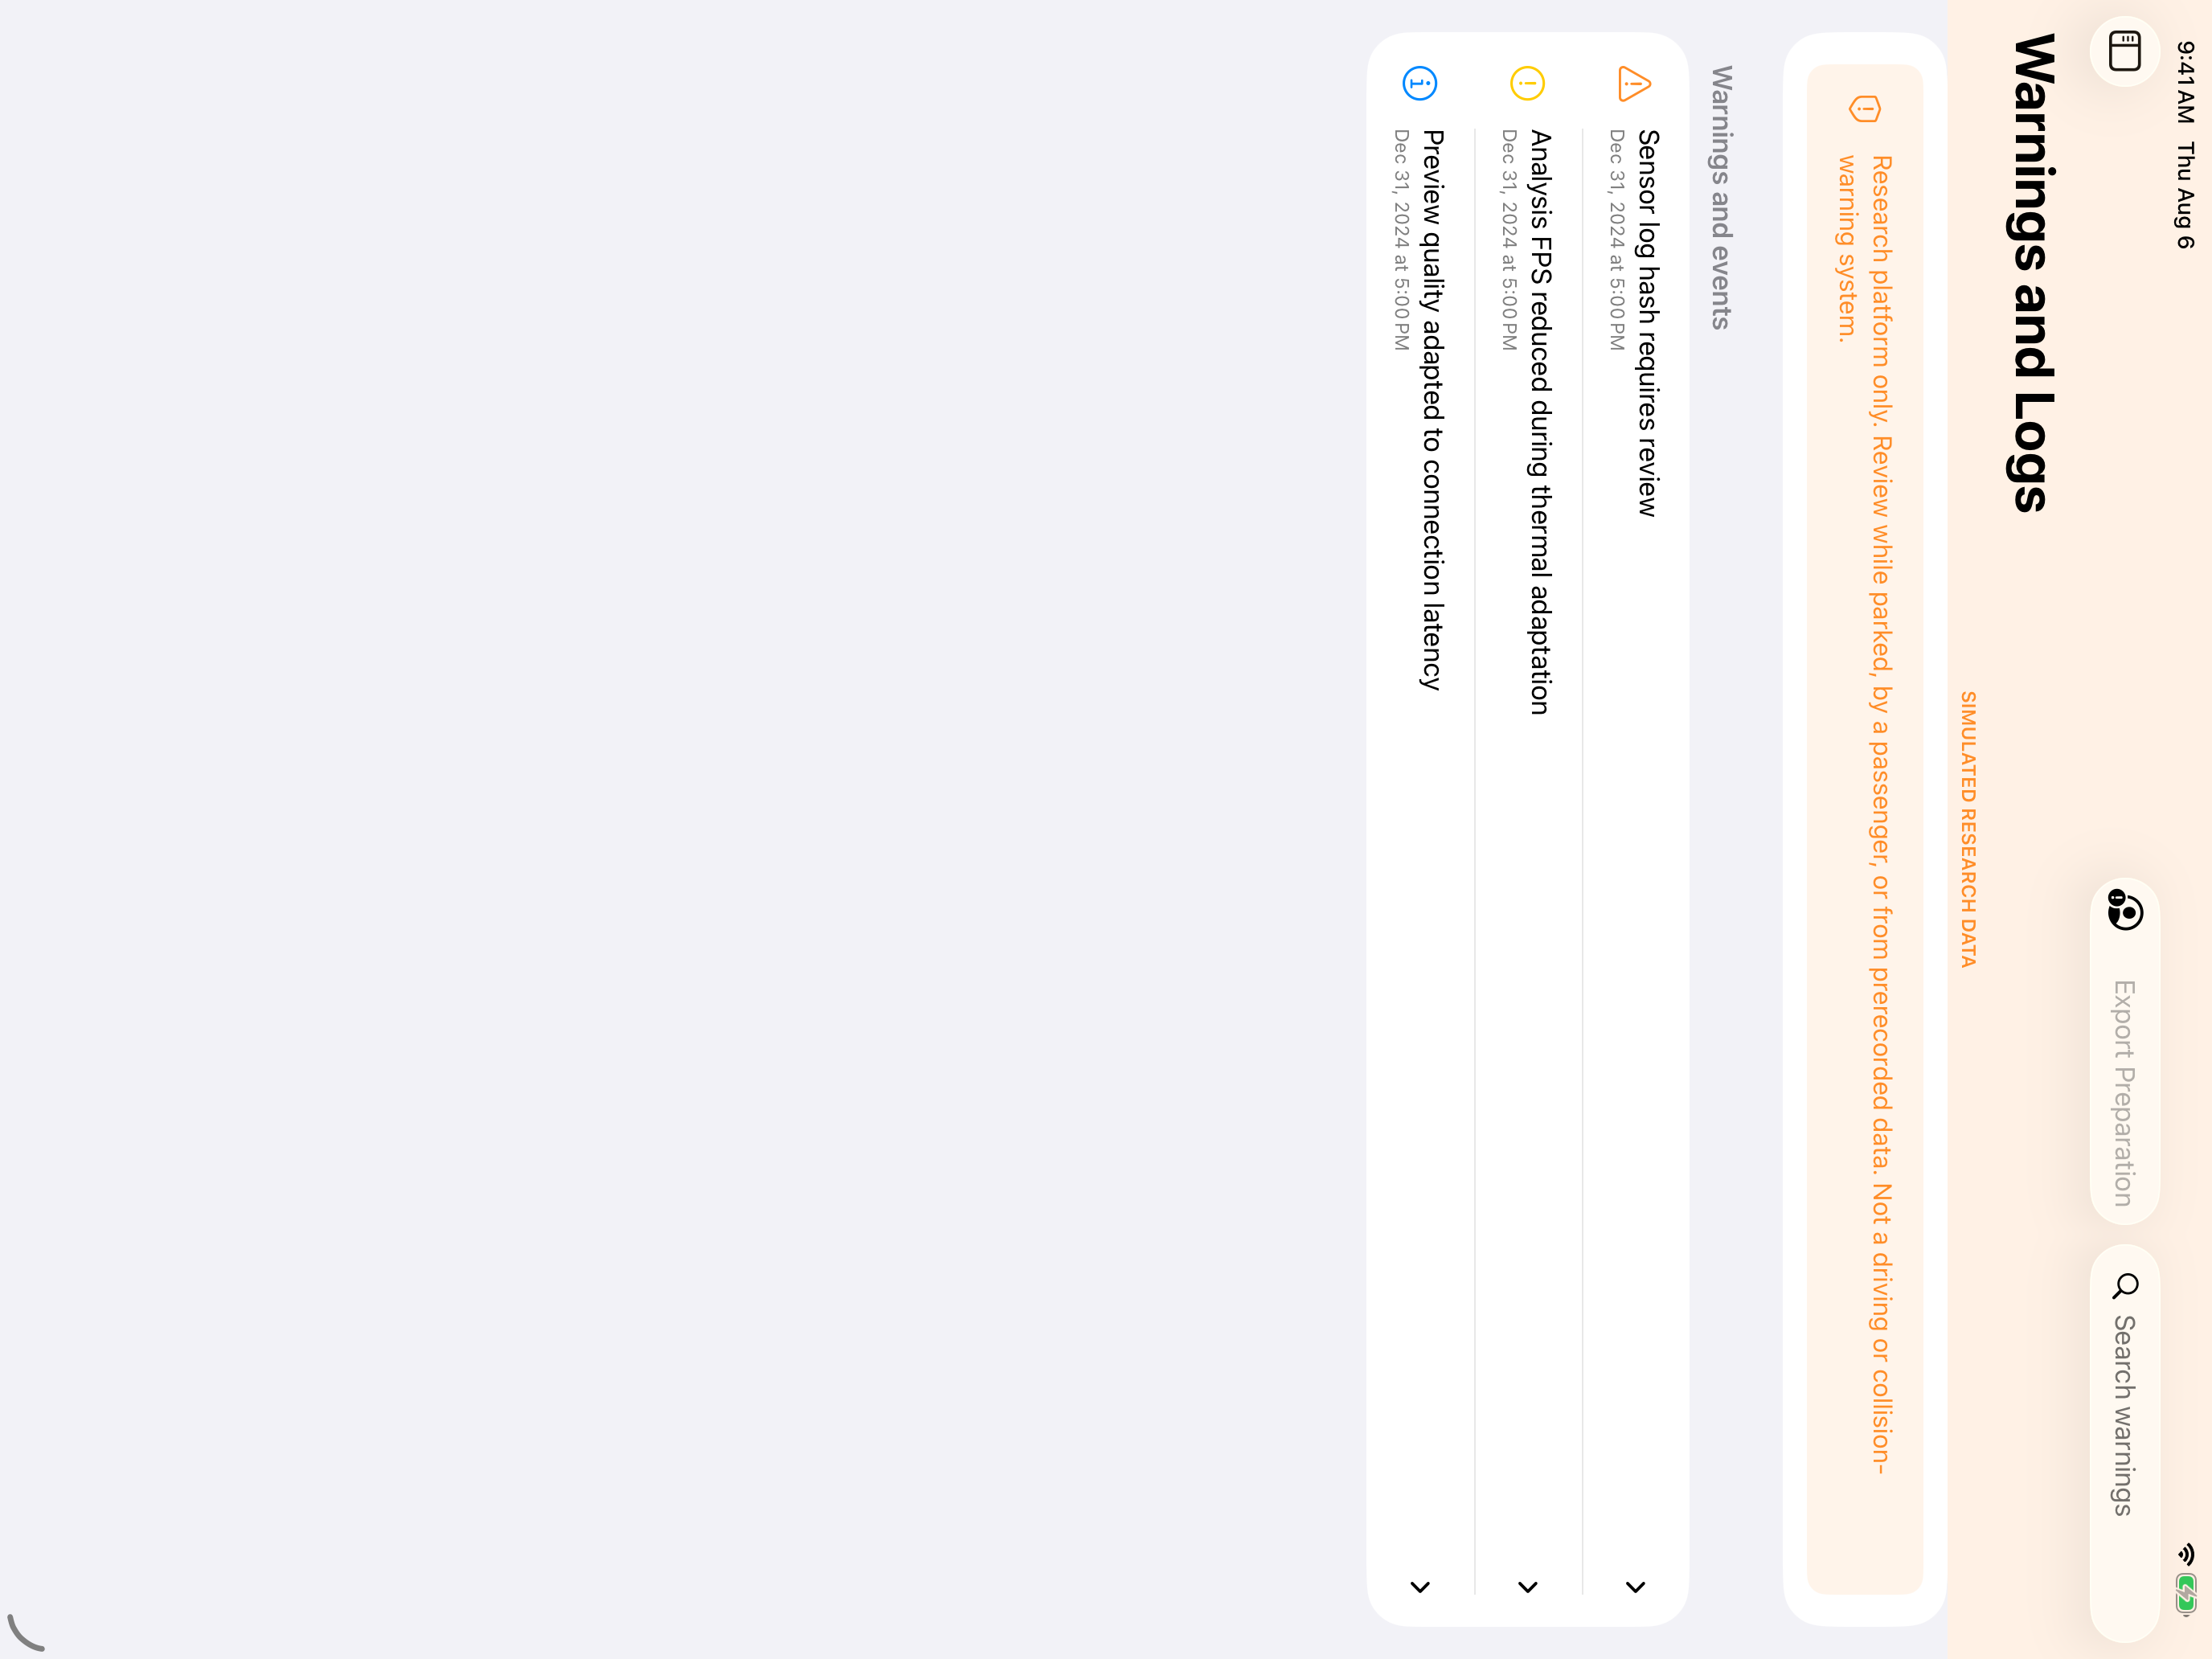
All images in this tour use Simulated Research Data. They do not represent a real driving study, a real location, or production model accuracy. OrganicVision is a research platform—not autonomous driving, collision warning, or a safety system. Review while parked, by a passenger, or from prerecorded sessions.
iPhone Camera Node
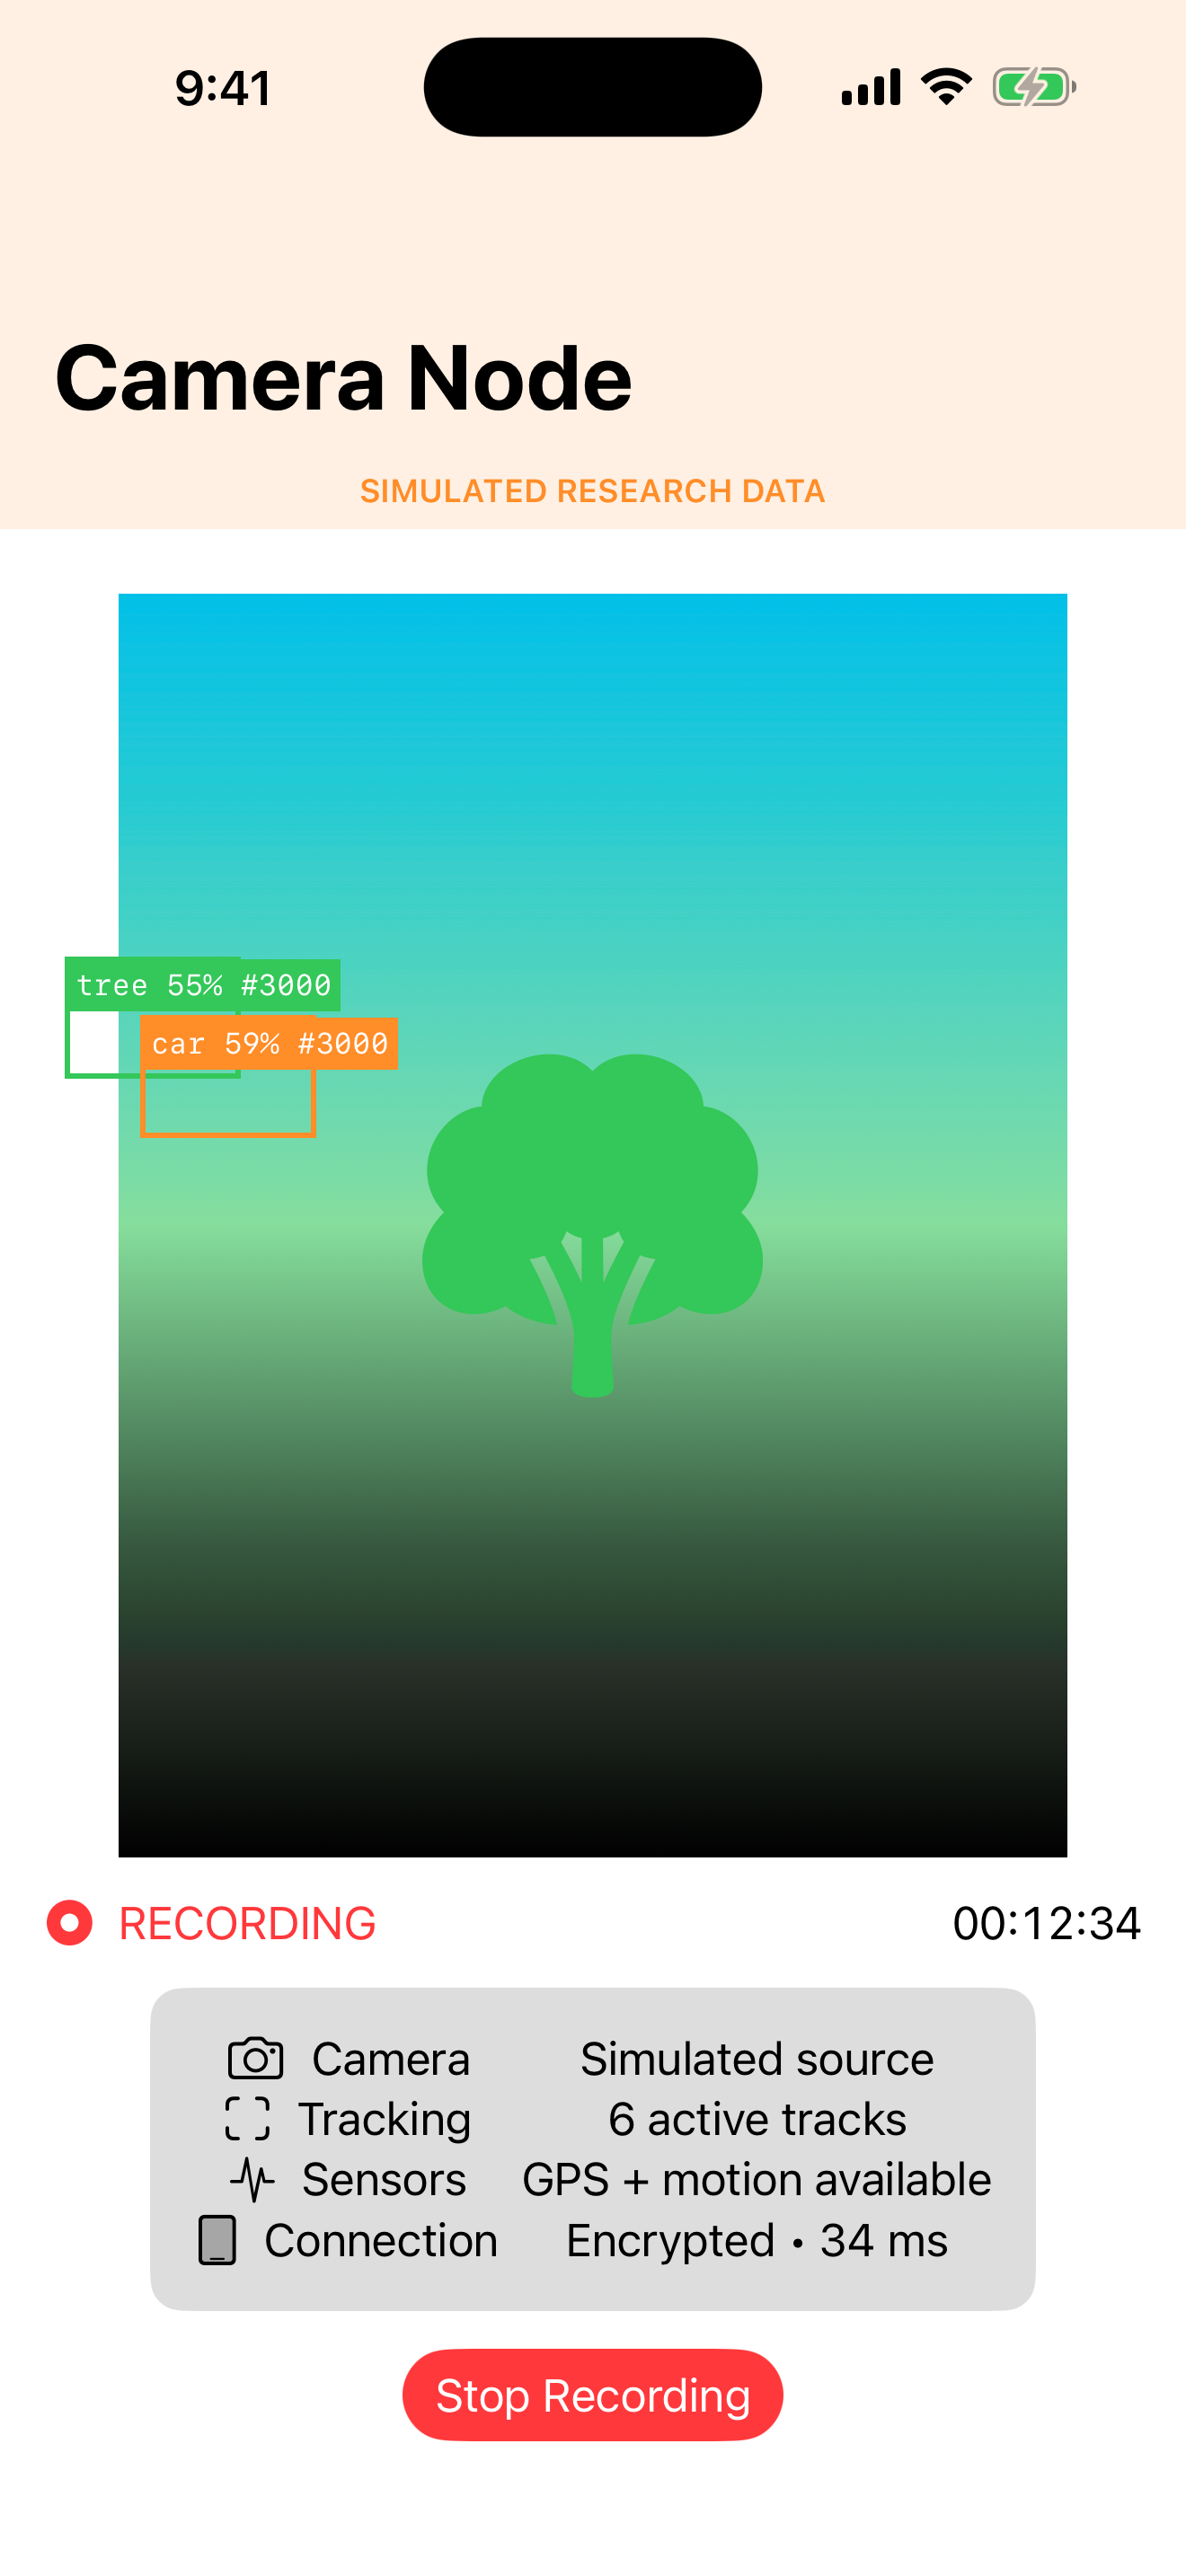
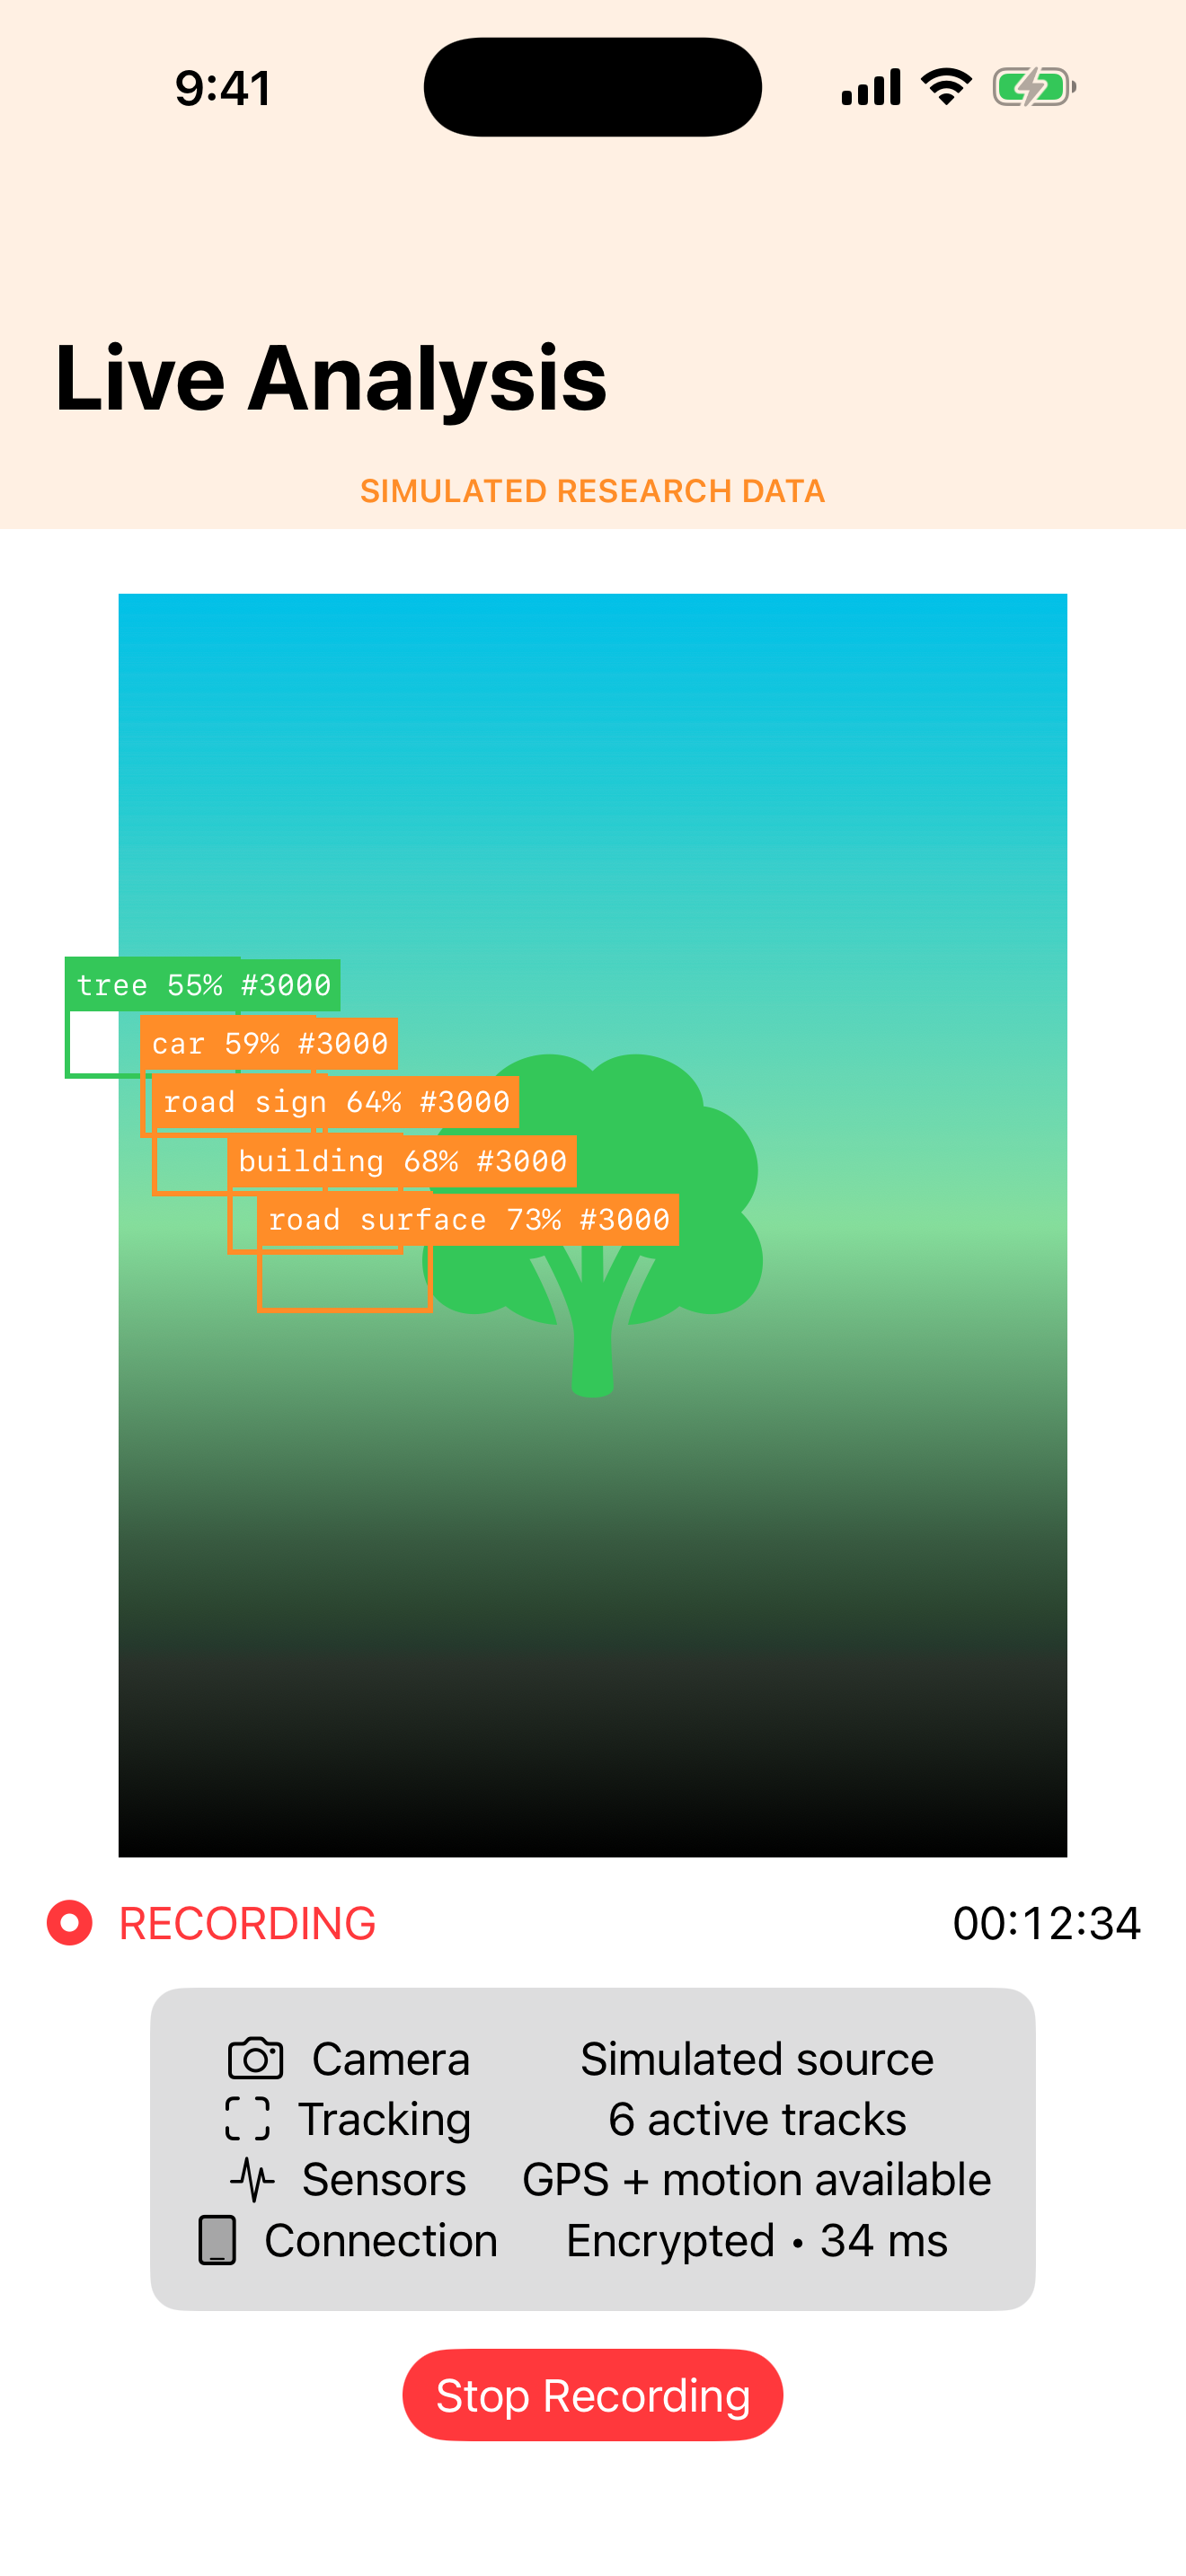
The iPhone remains a focused recorder. It combines camera and sensor status with lightweight live analysis and encrypted Research Console status.
iPad Research Console
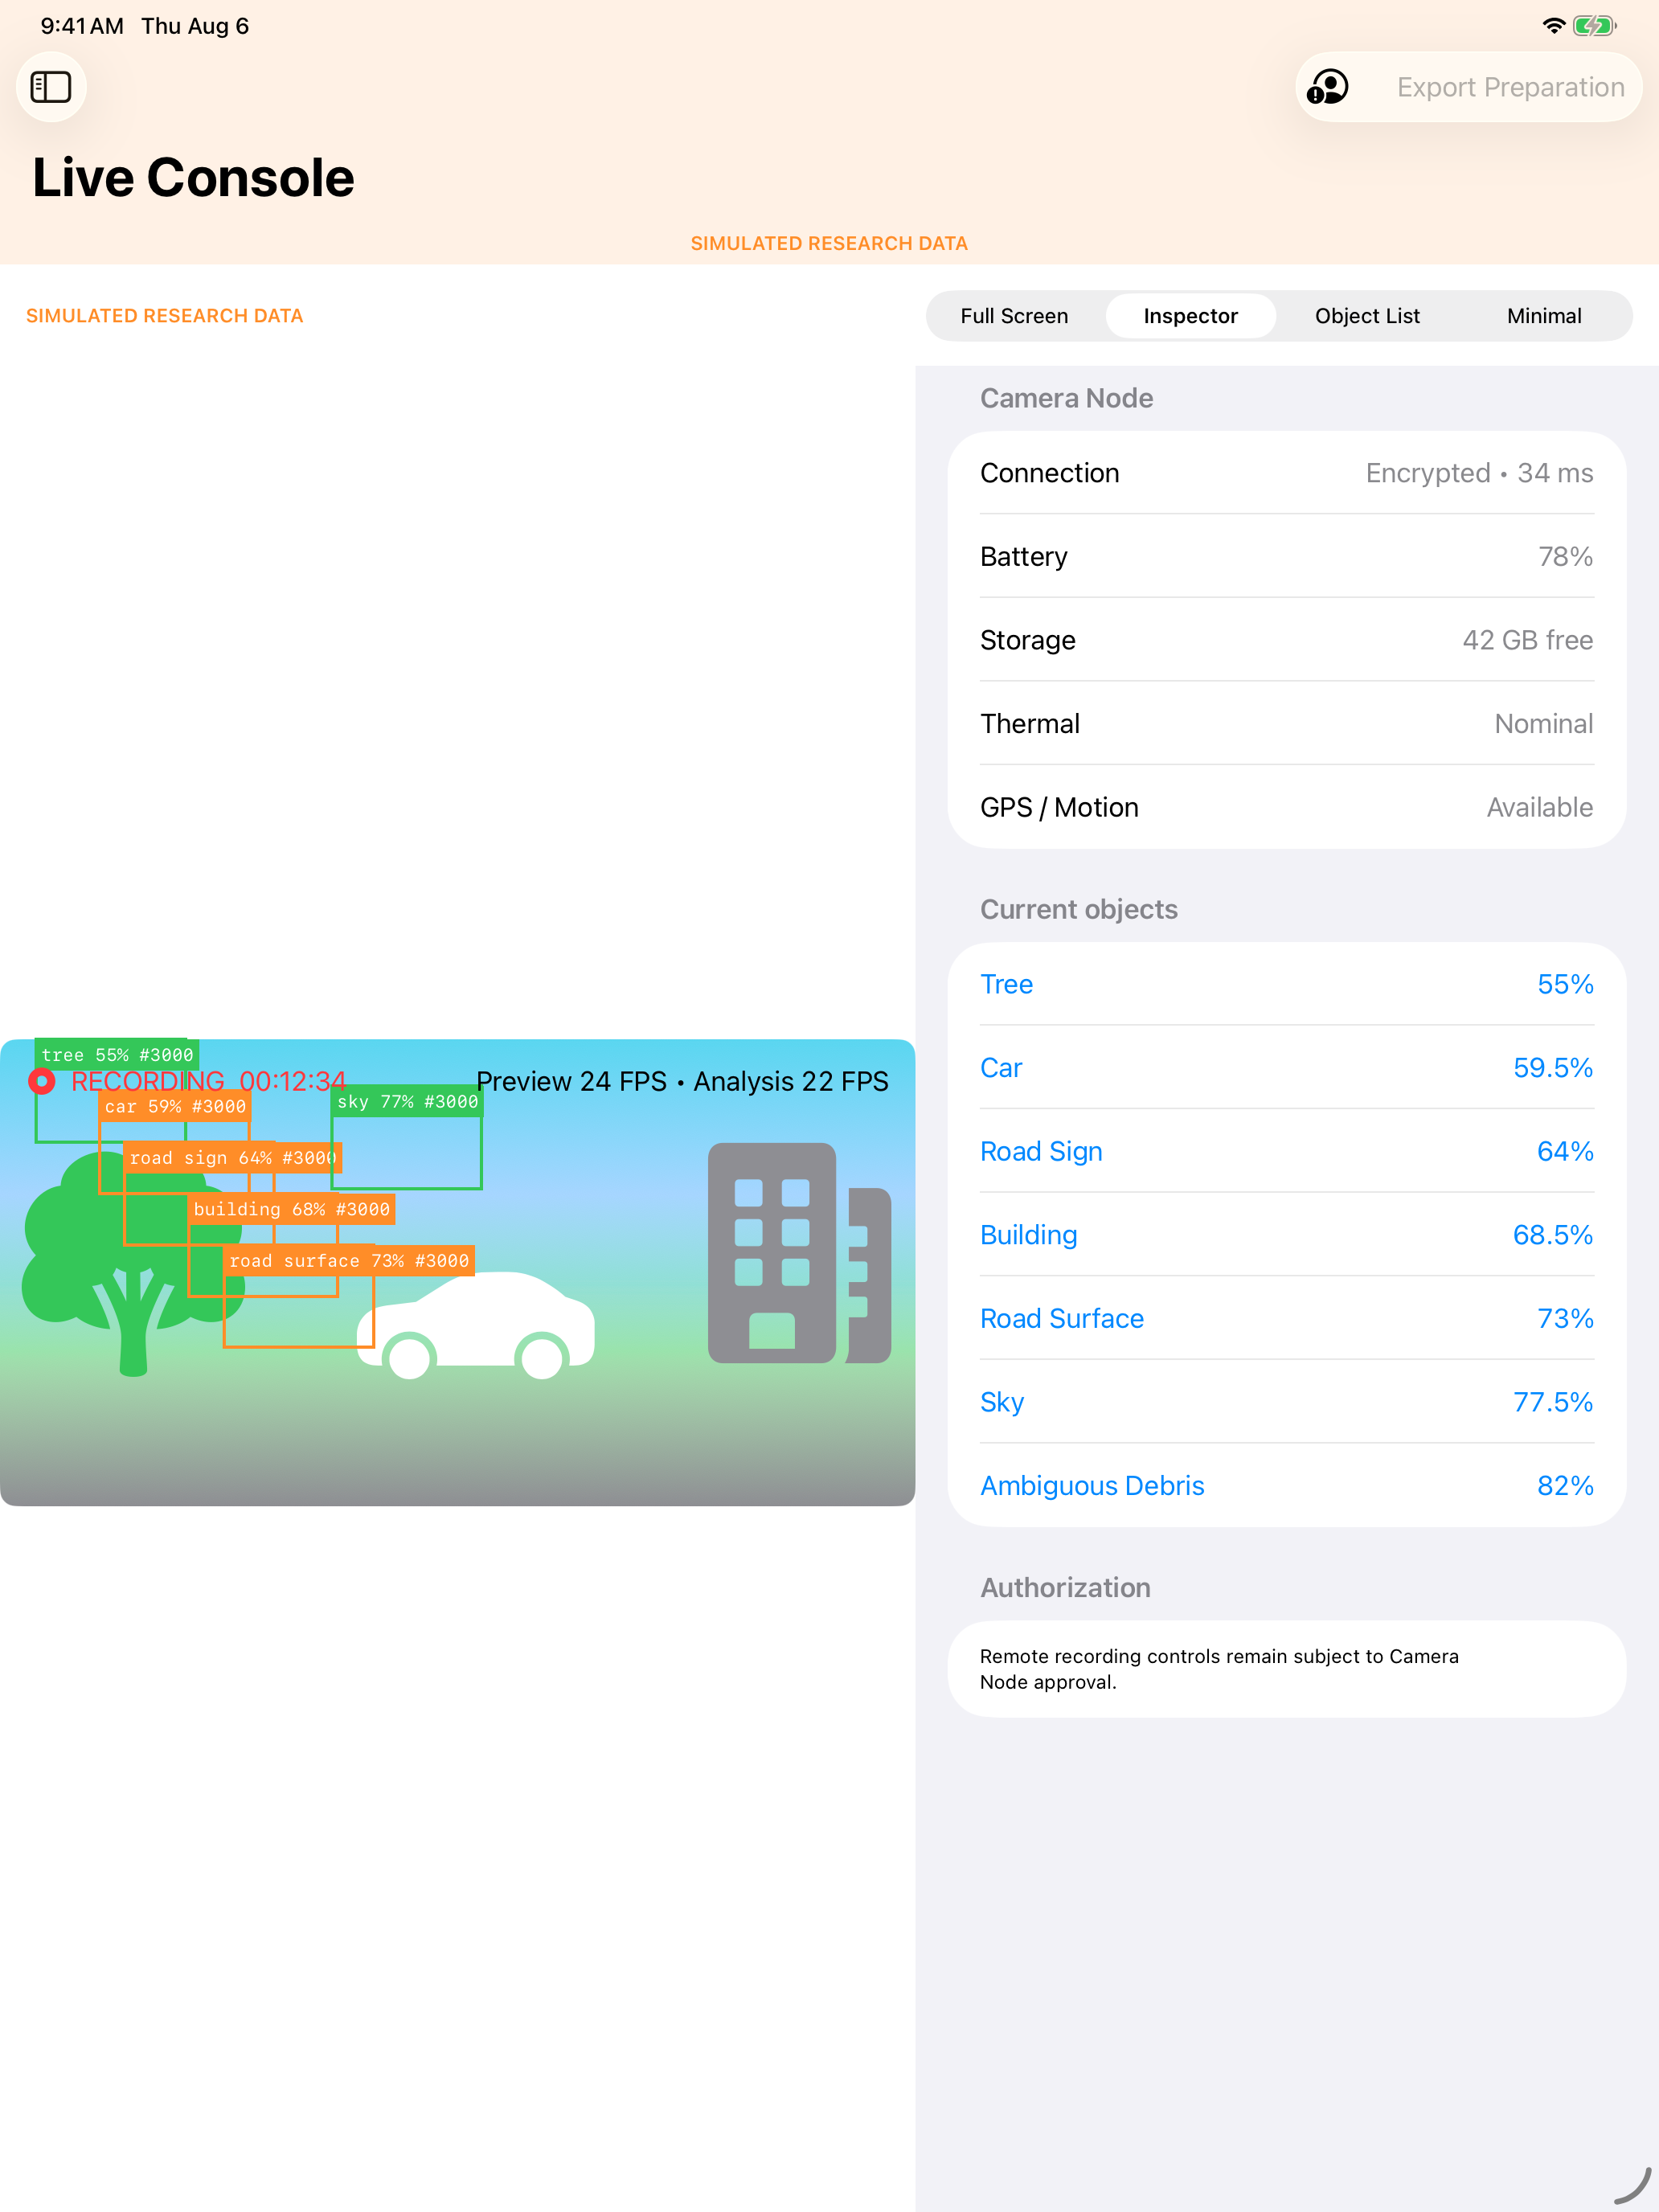
The iPad is the portable research dashboard. The overview summarizes sessions, storage, analysis runs, objects, tracks, review work, charts, and recent warnings without loading private data.

macOS Research Workstation
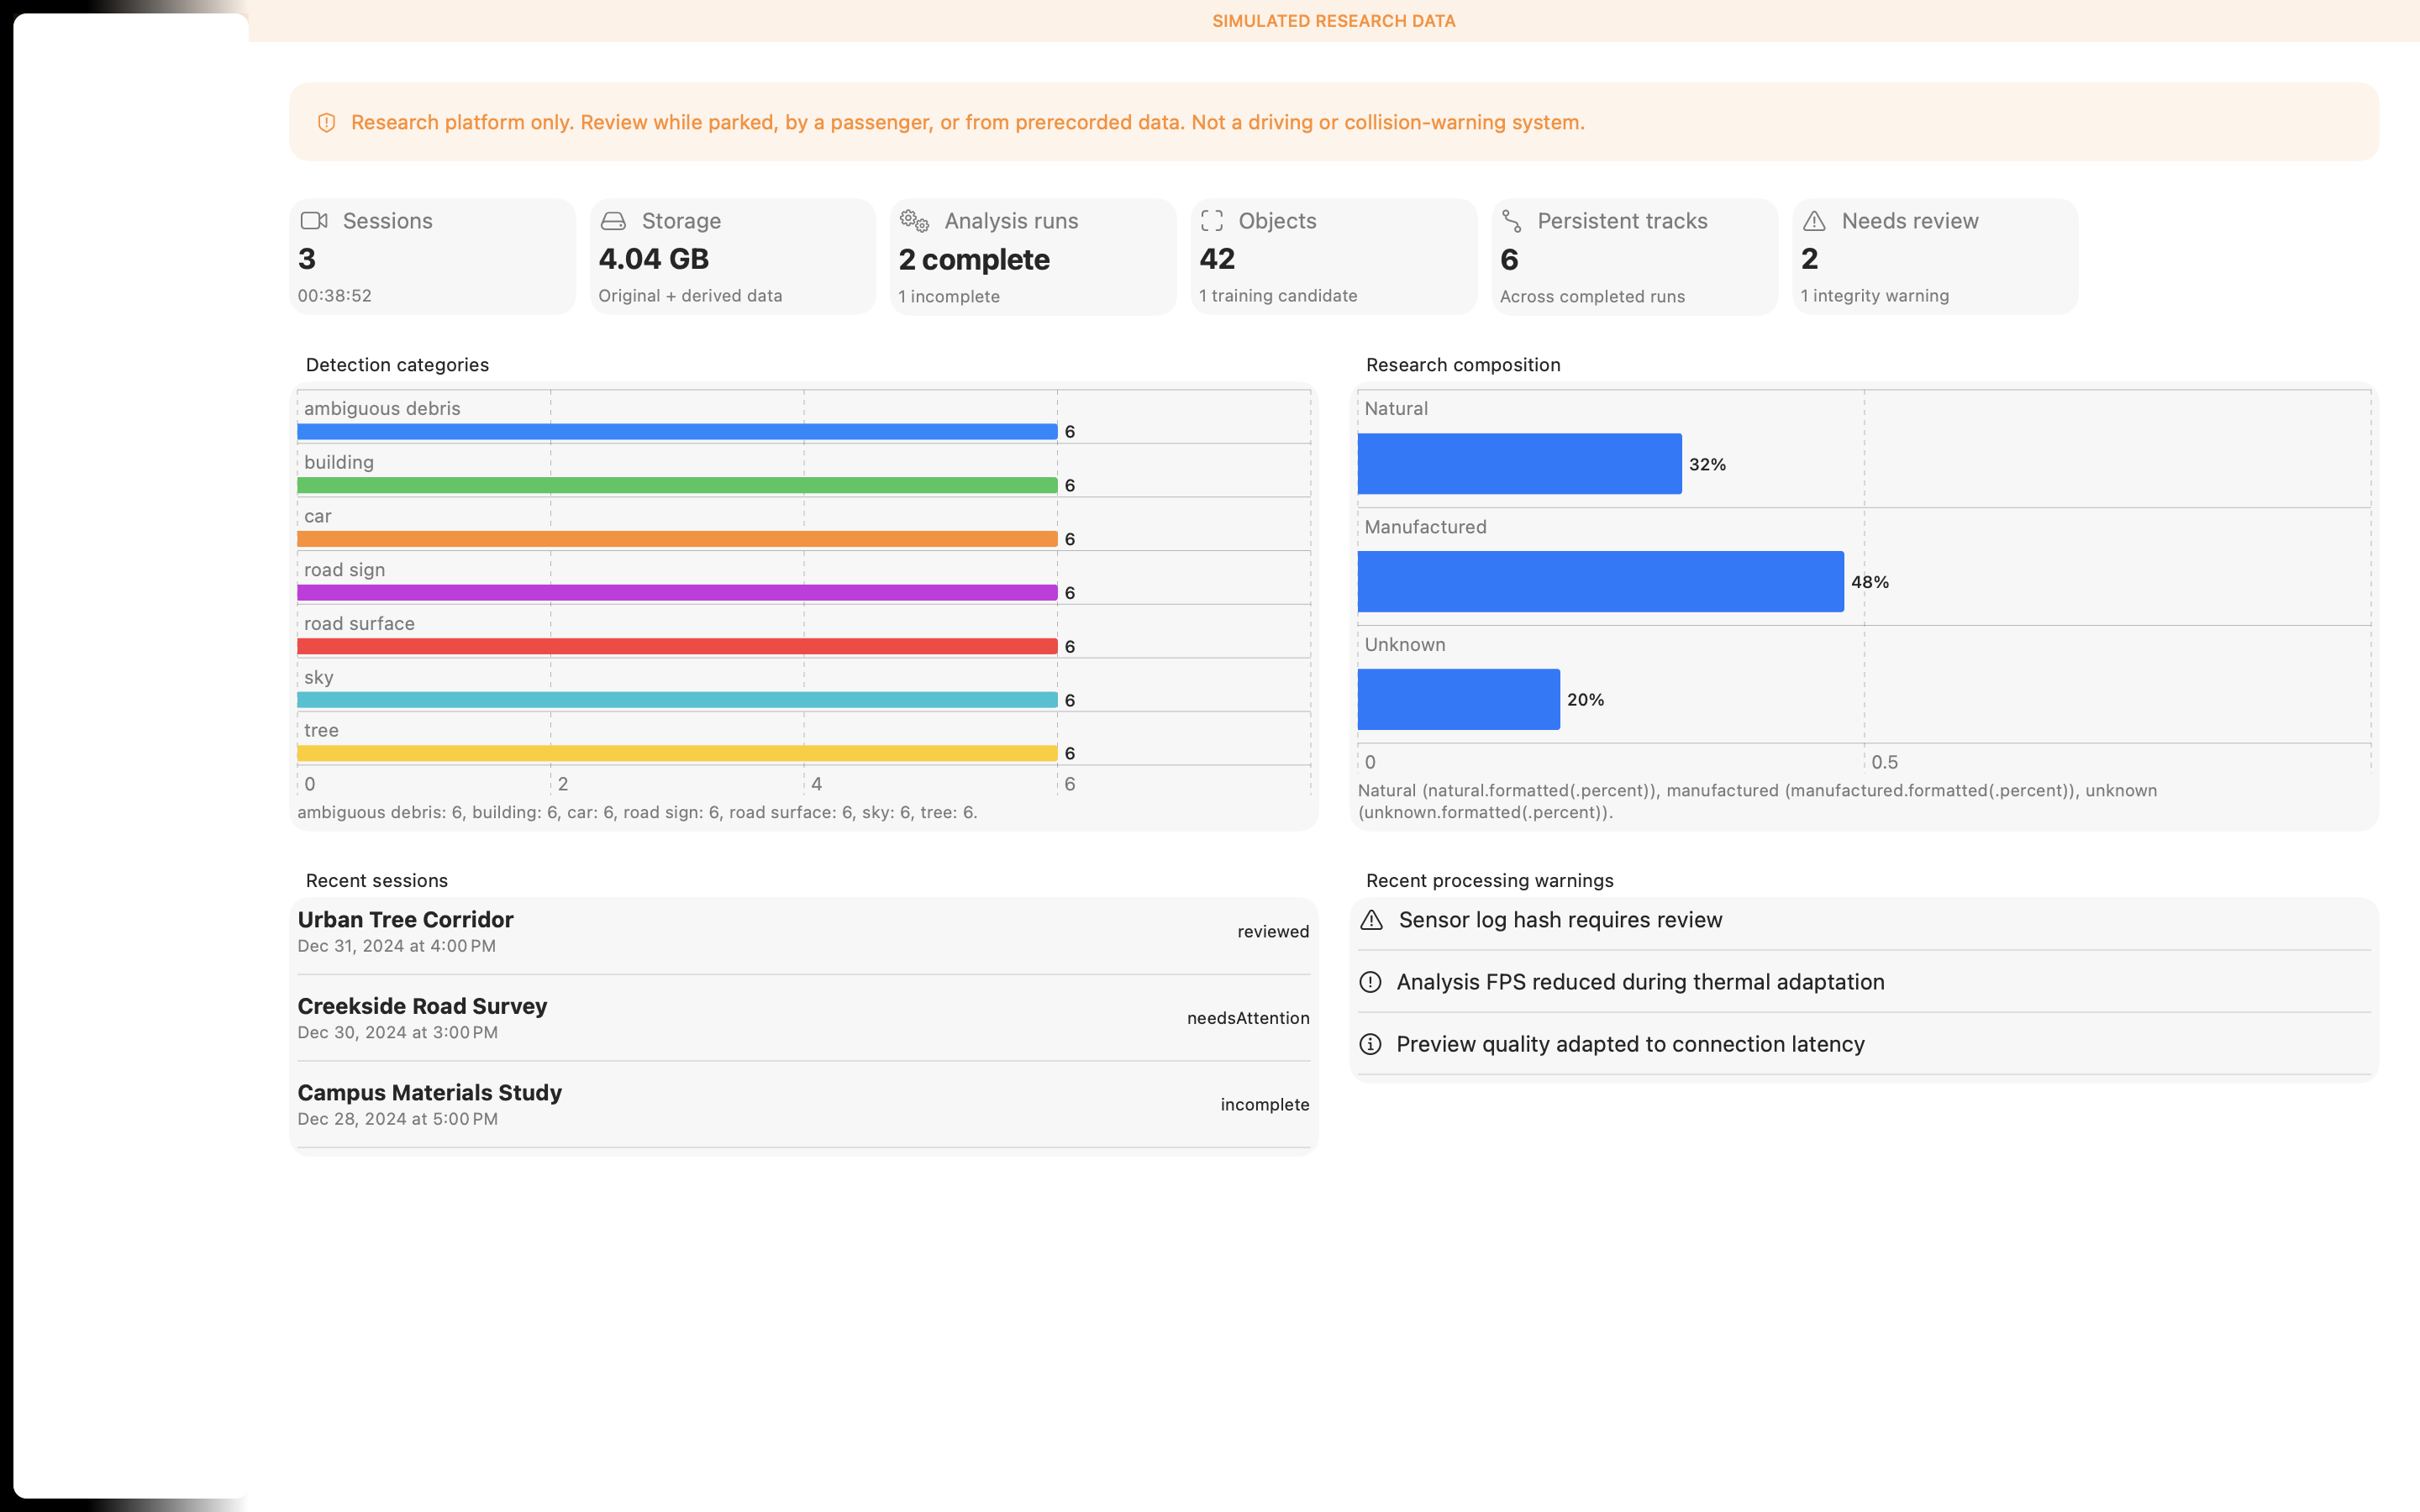
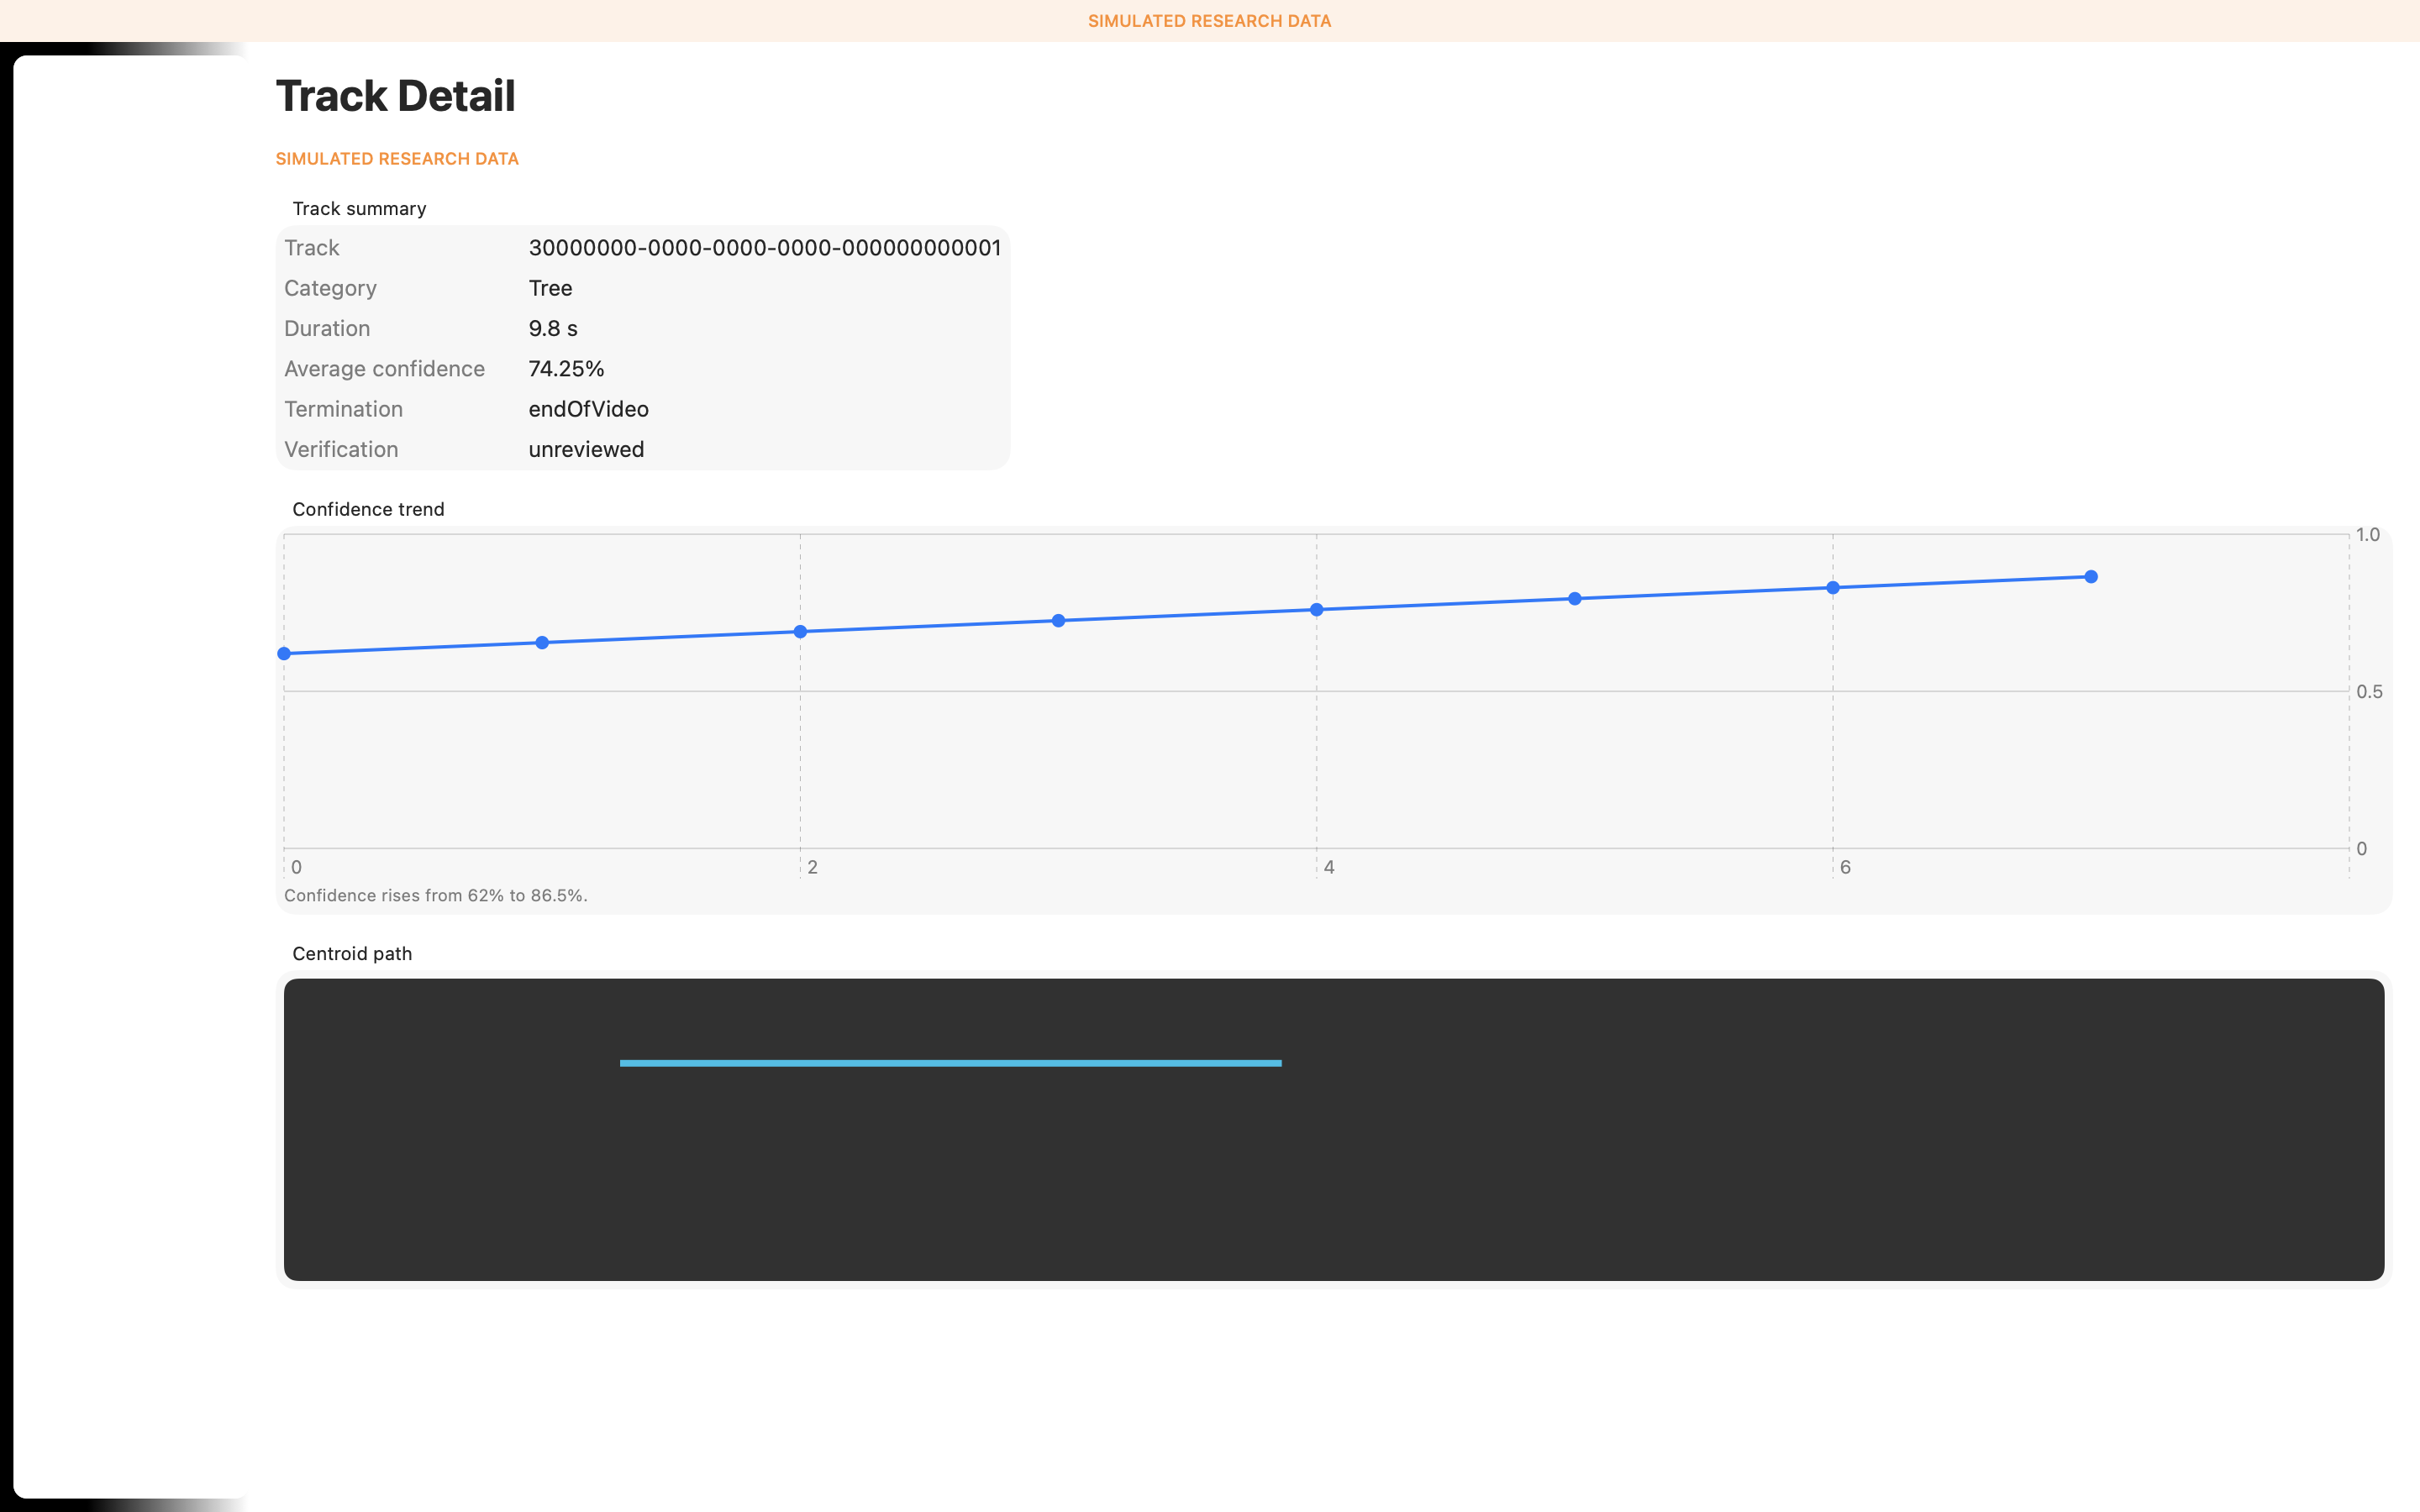
The Mac provides a larger review surface for catalogs, charts, object searches, track details, comparison, and export preparation.
Recording a session
The source video remains immutable. Recording, sensor collection, preview transport, and derived analysis results keep their existing Phase 2–5 boundaries.
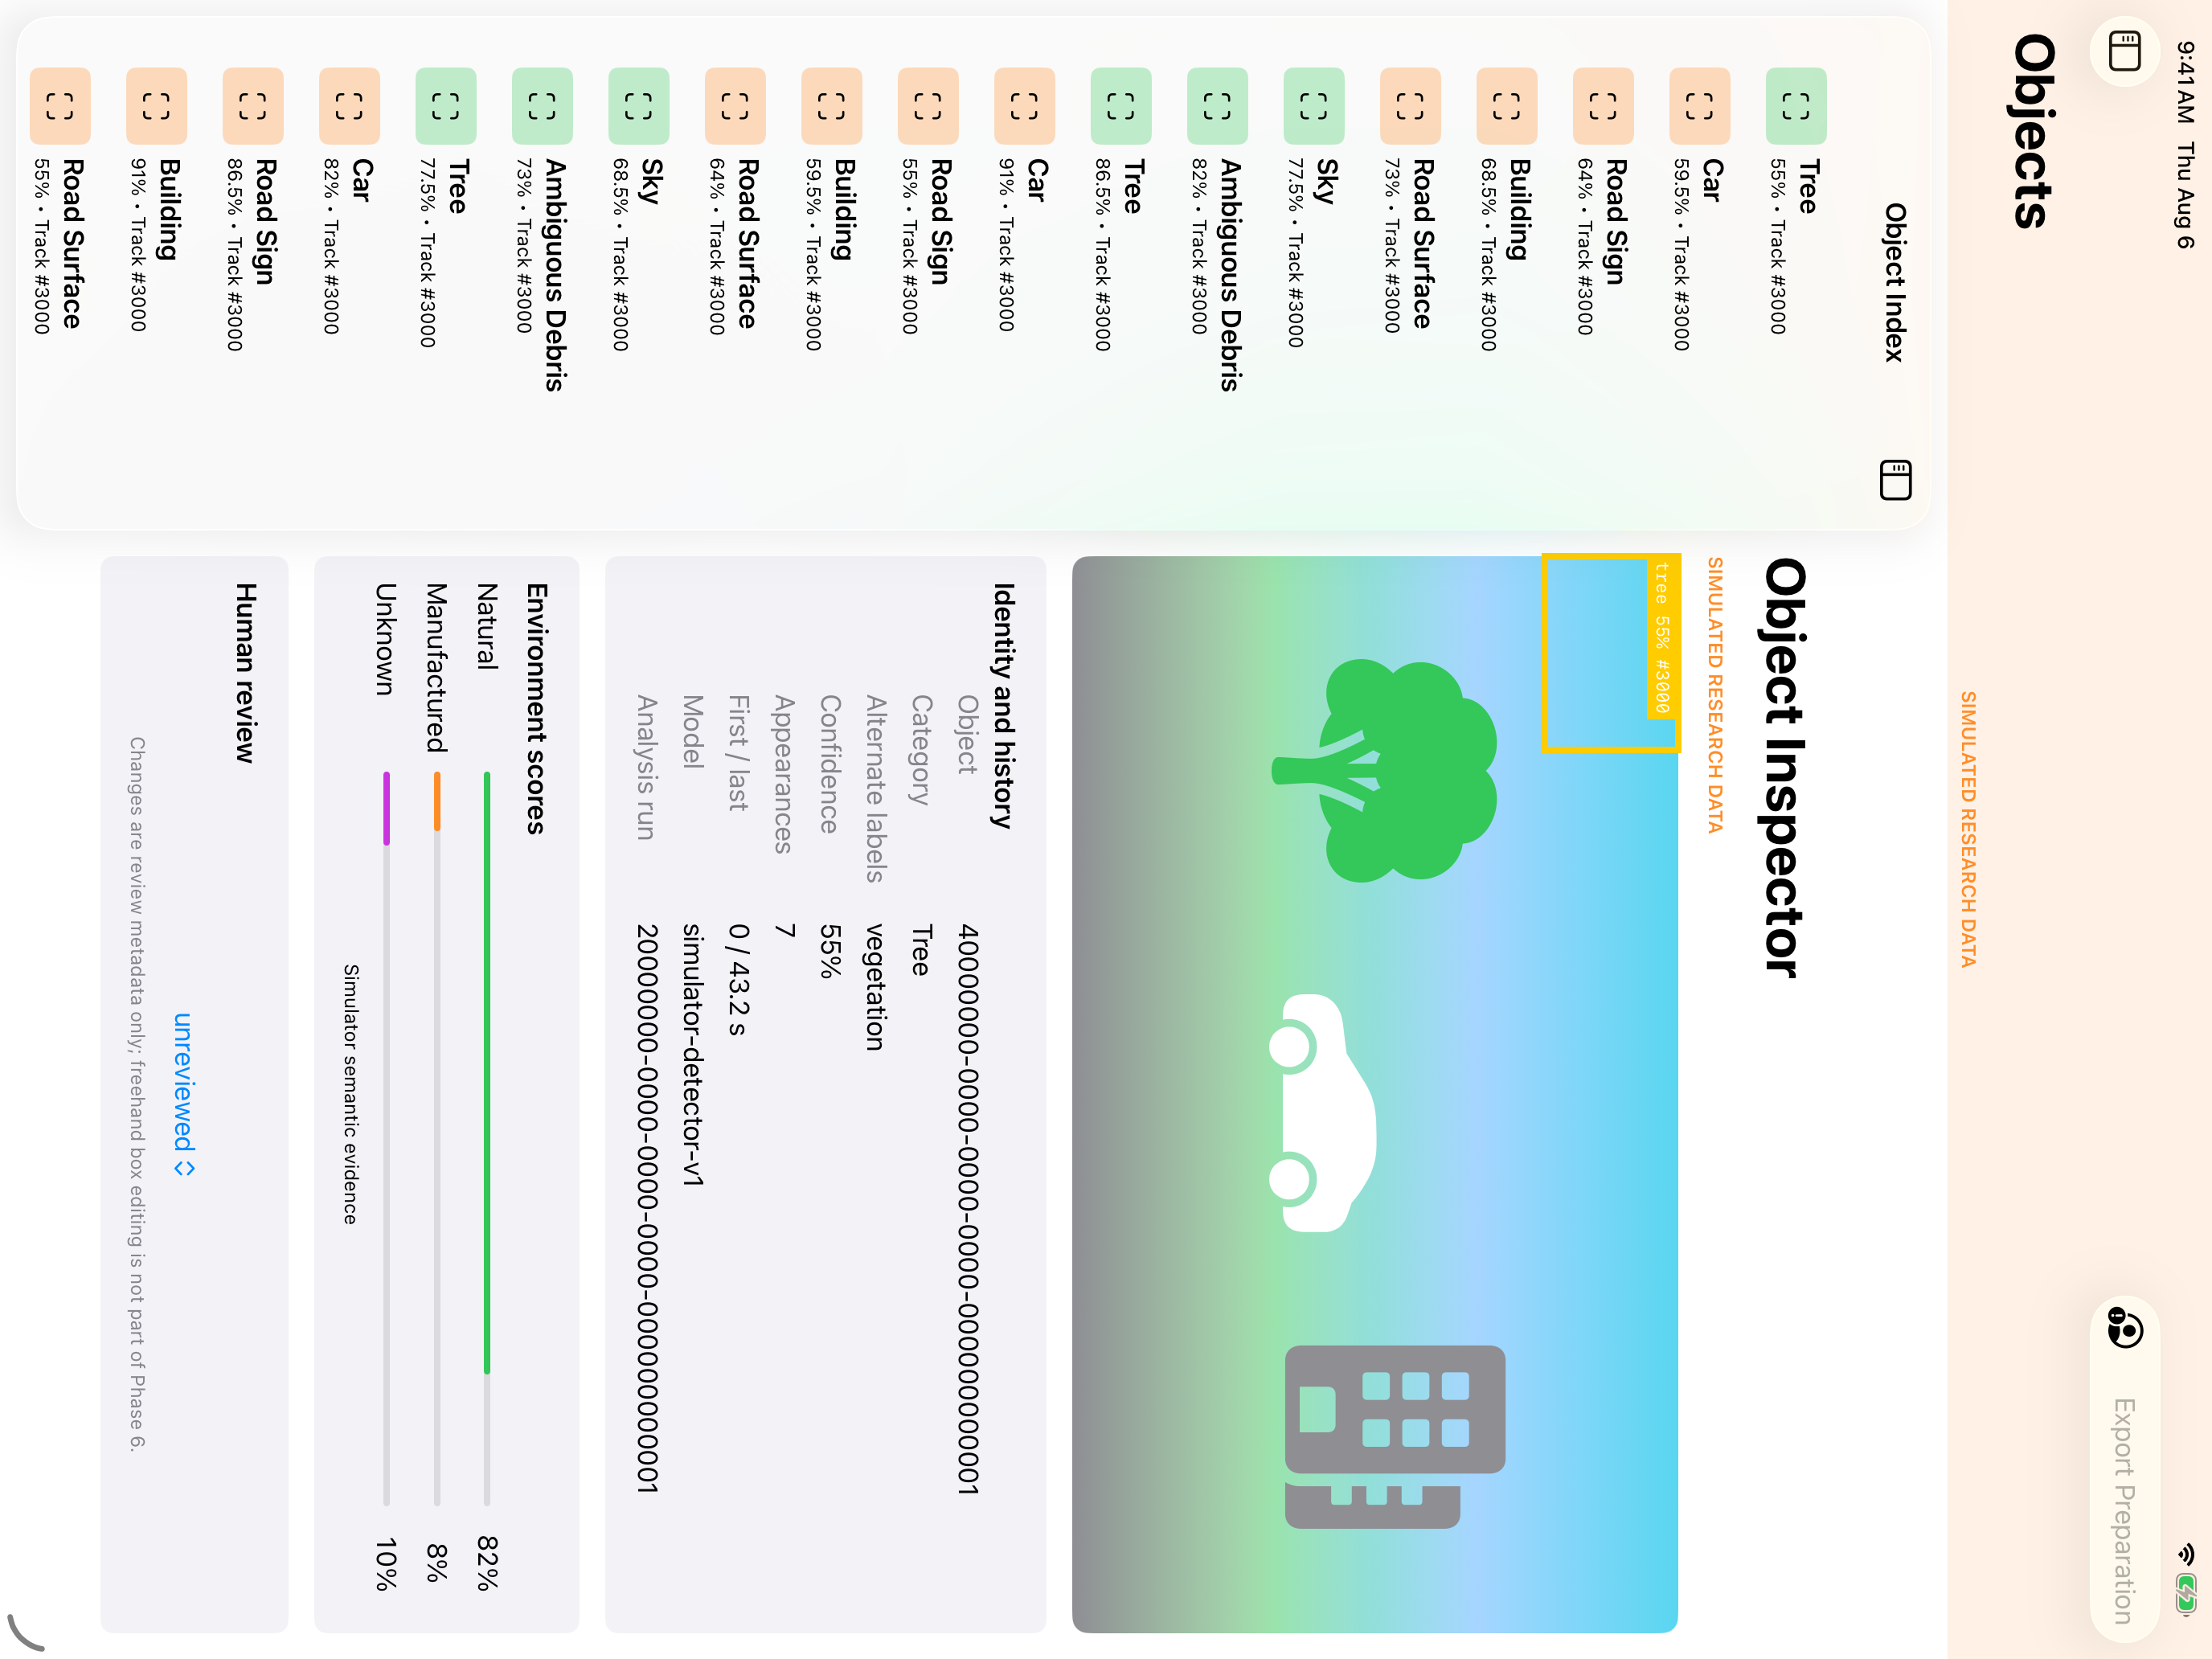
Reviewing objects
The session-review screen synchronizes overlays, frame position, presentation time, session-relative time, timeline events, and sensor availability. Frame stepping is available while paused at 0.25×, 0.5×, 1×, 2×, and 4× playback settings.
Comparing analysis runs
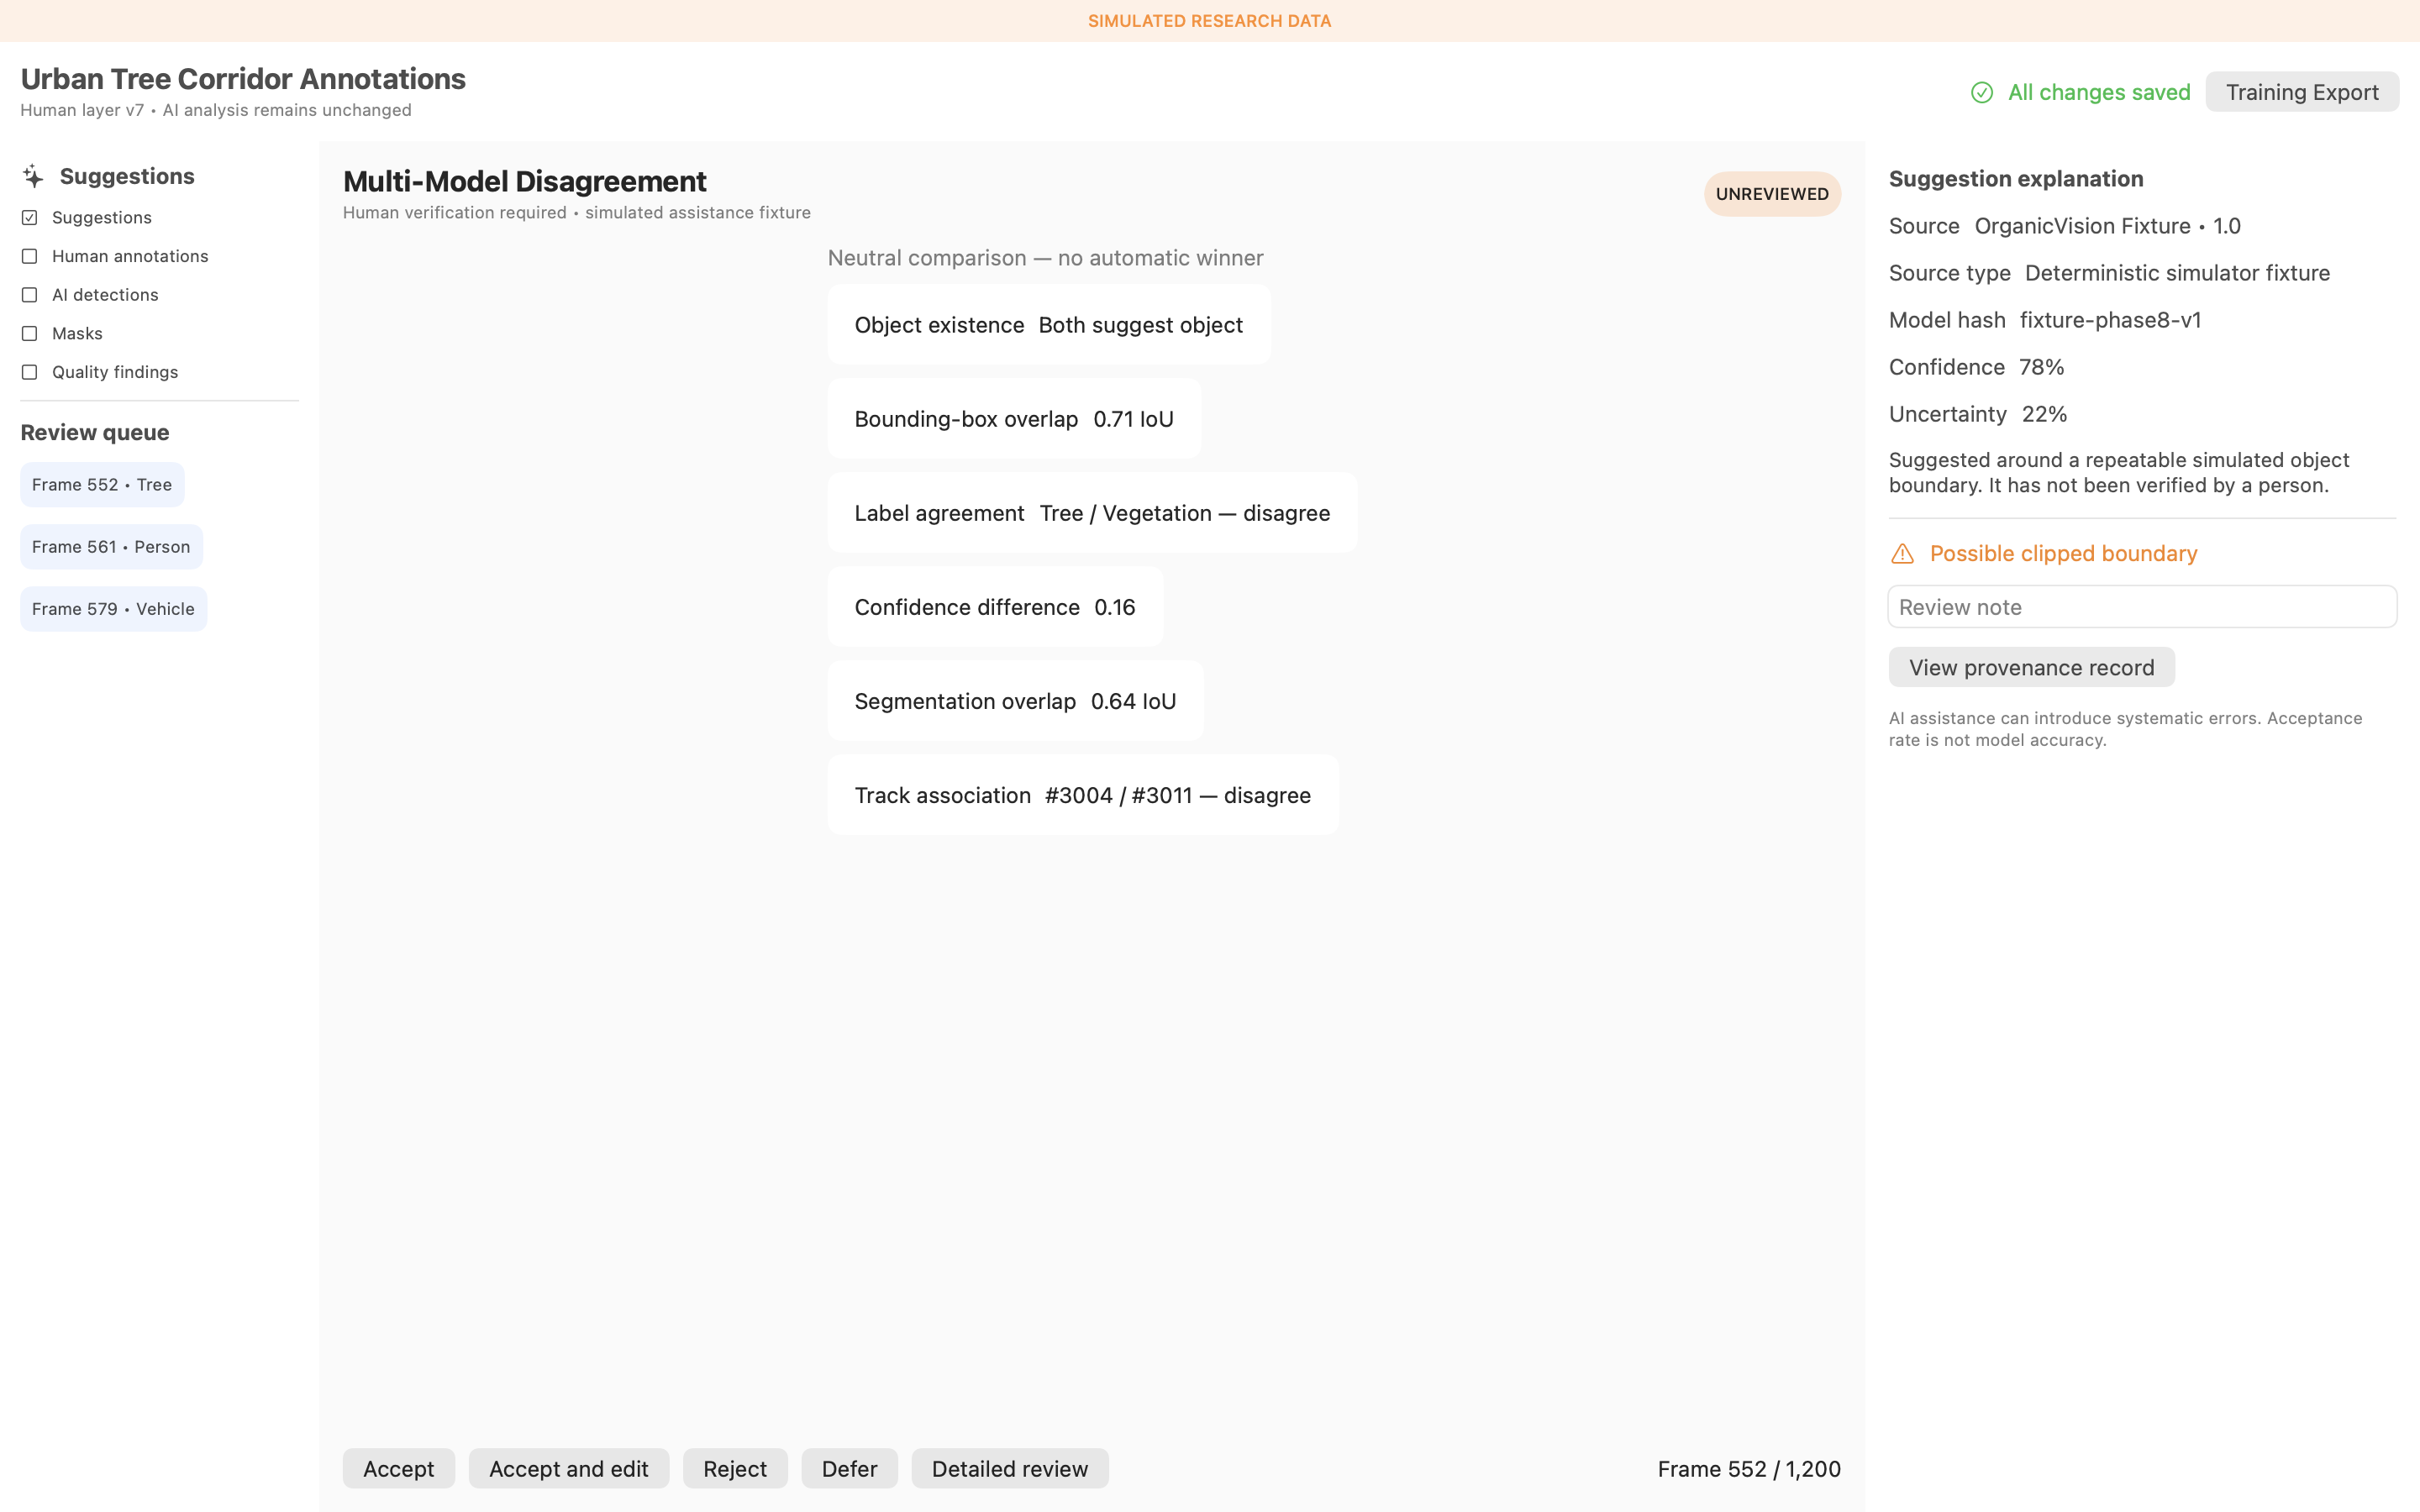
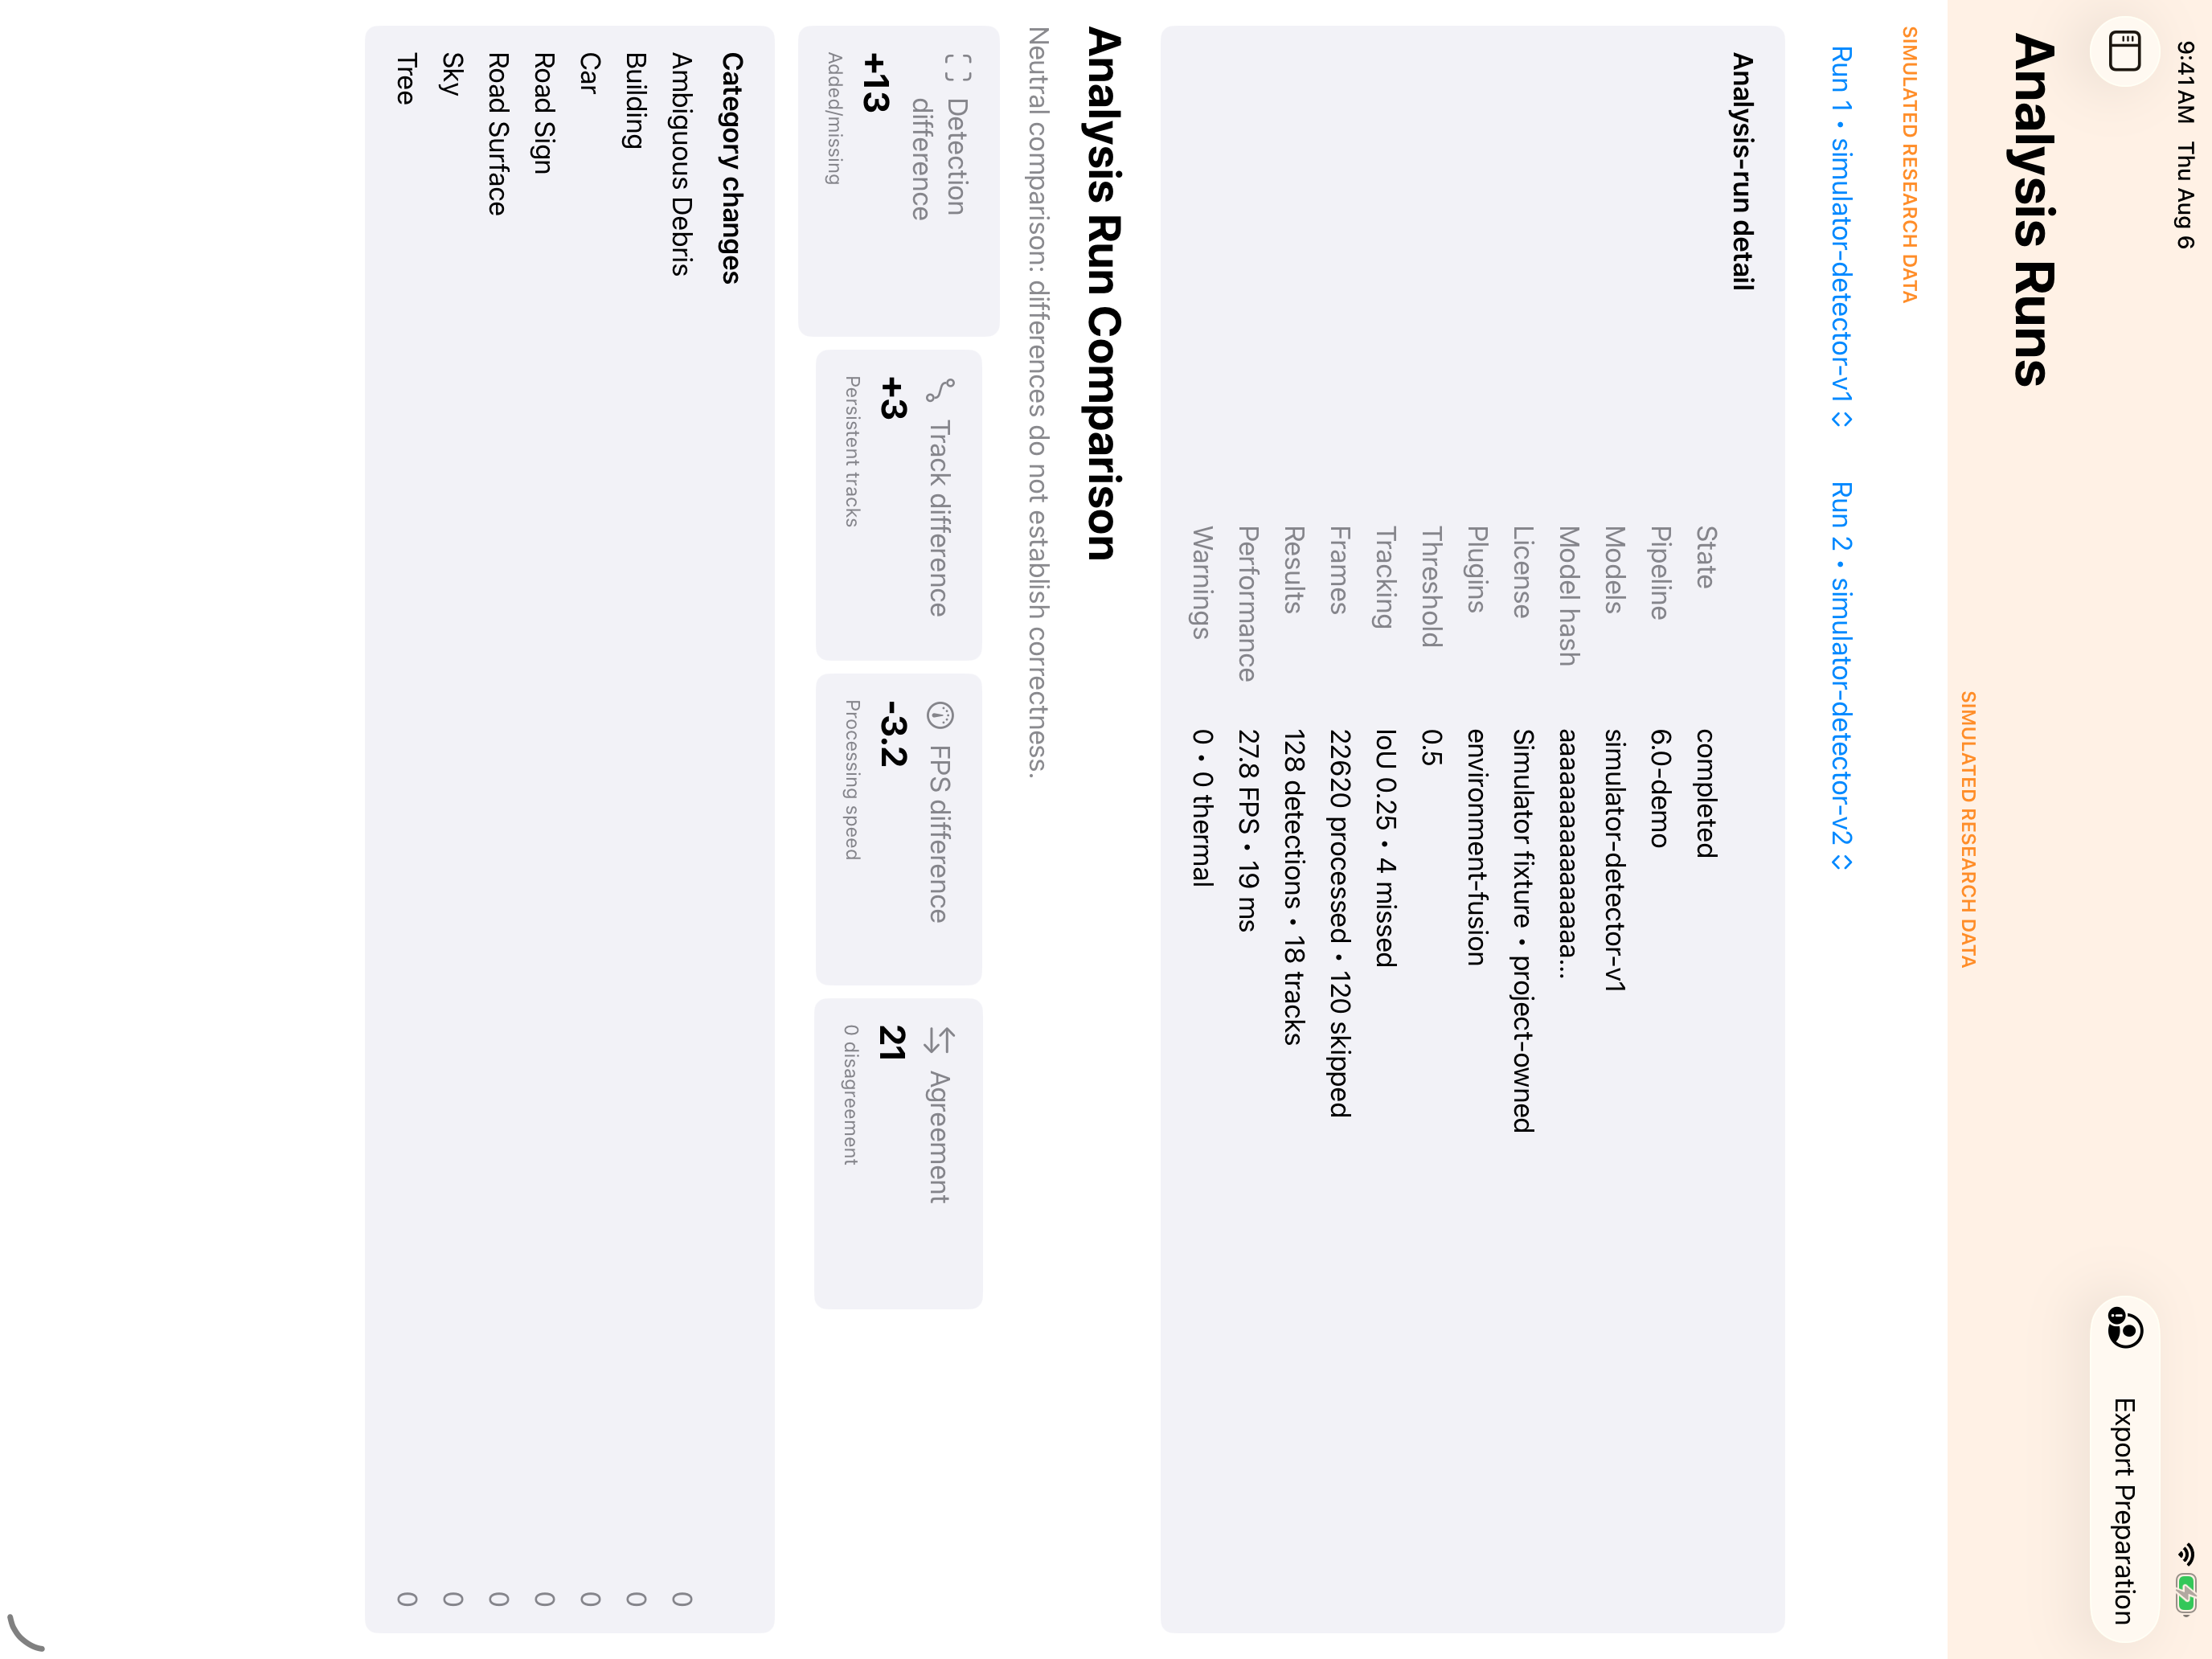
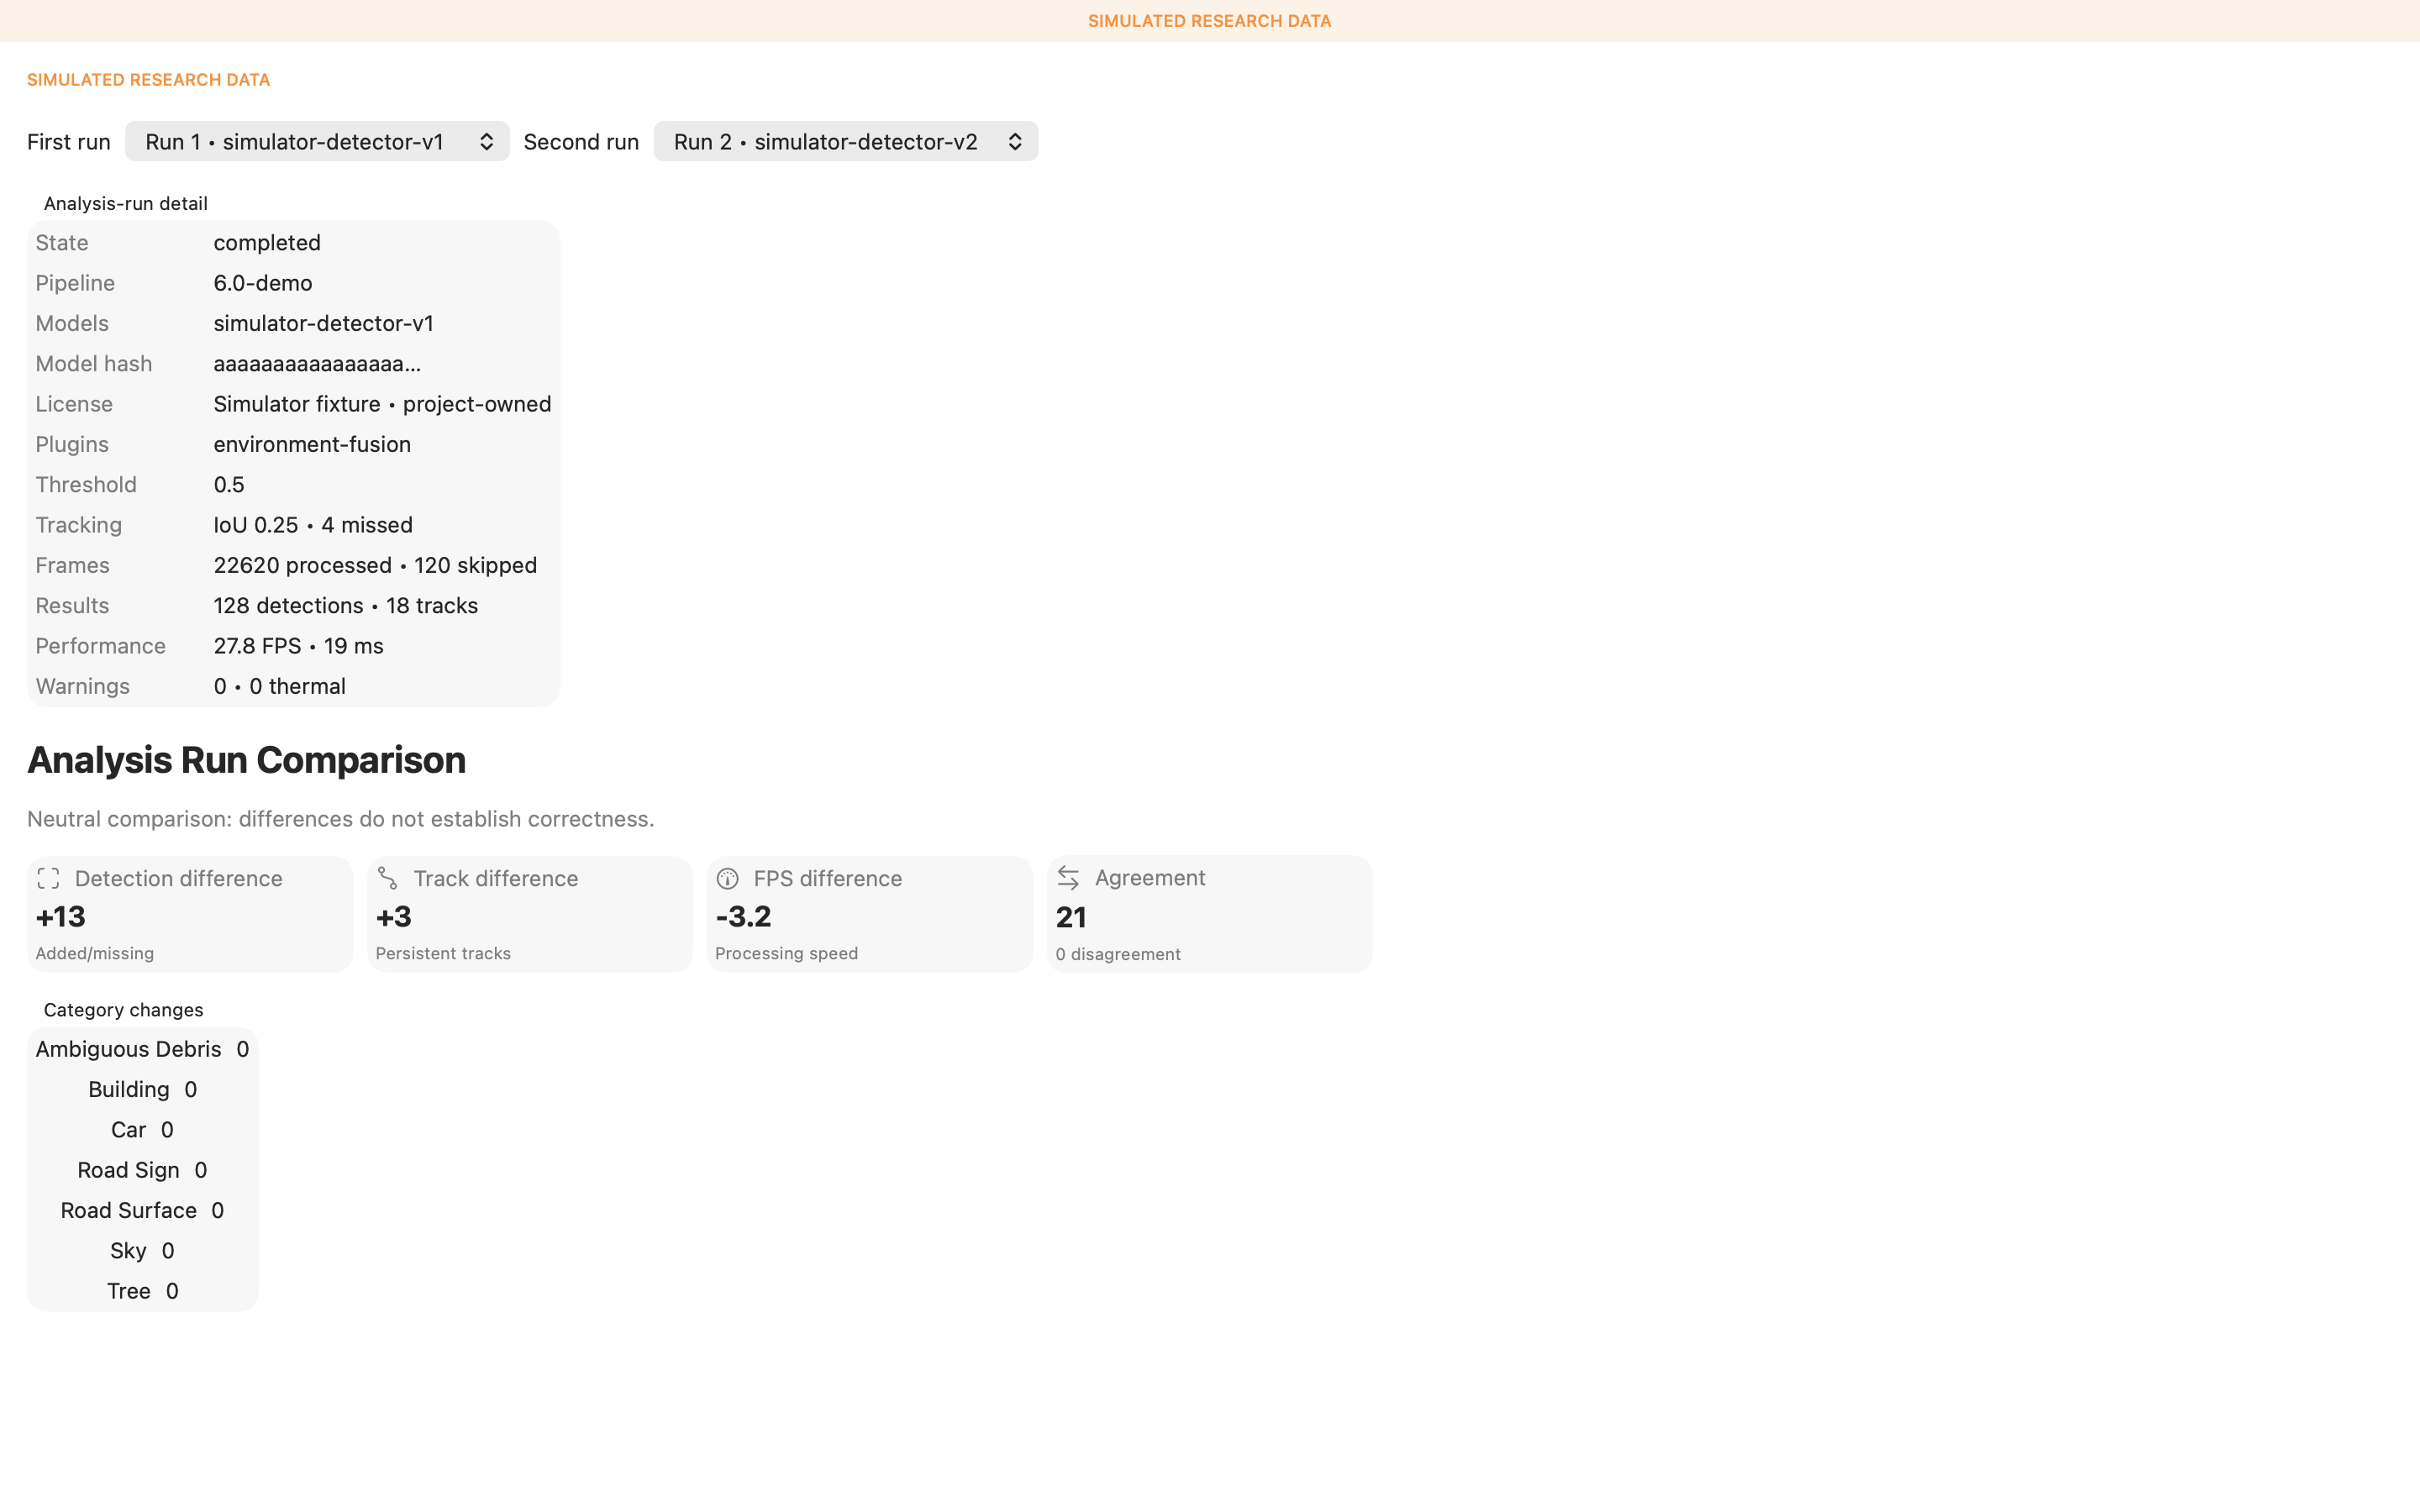
Comparisons use neutral language. A difference, agreement, disagreement, added detection, missing detection, or changed category does not automatically identify the correct result.
Understanding warnings
Warnings combine capture, storage, sensor, network, analysis, model, integrity, thermal, import, and export events. Experimental classification uncertainty remains a review concern rather than a system failure.
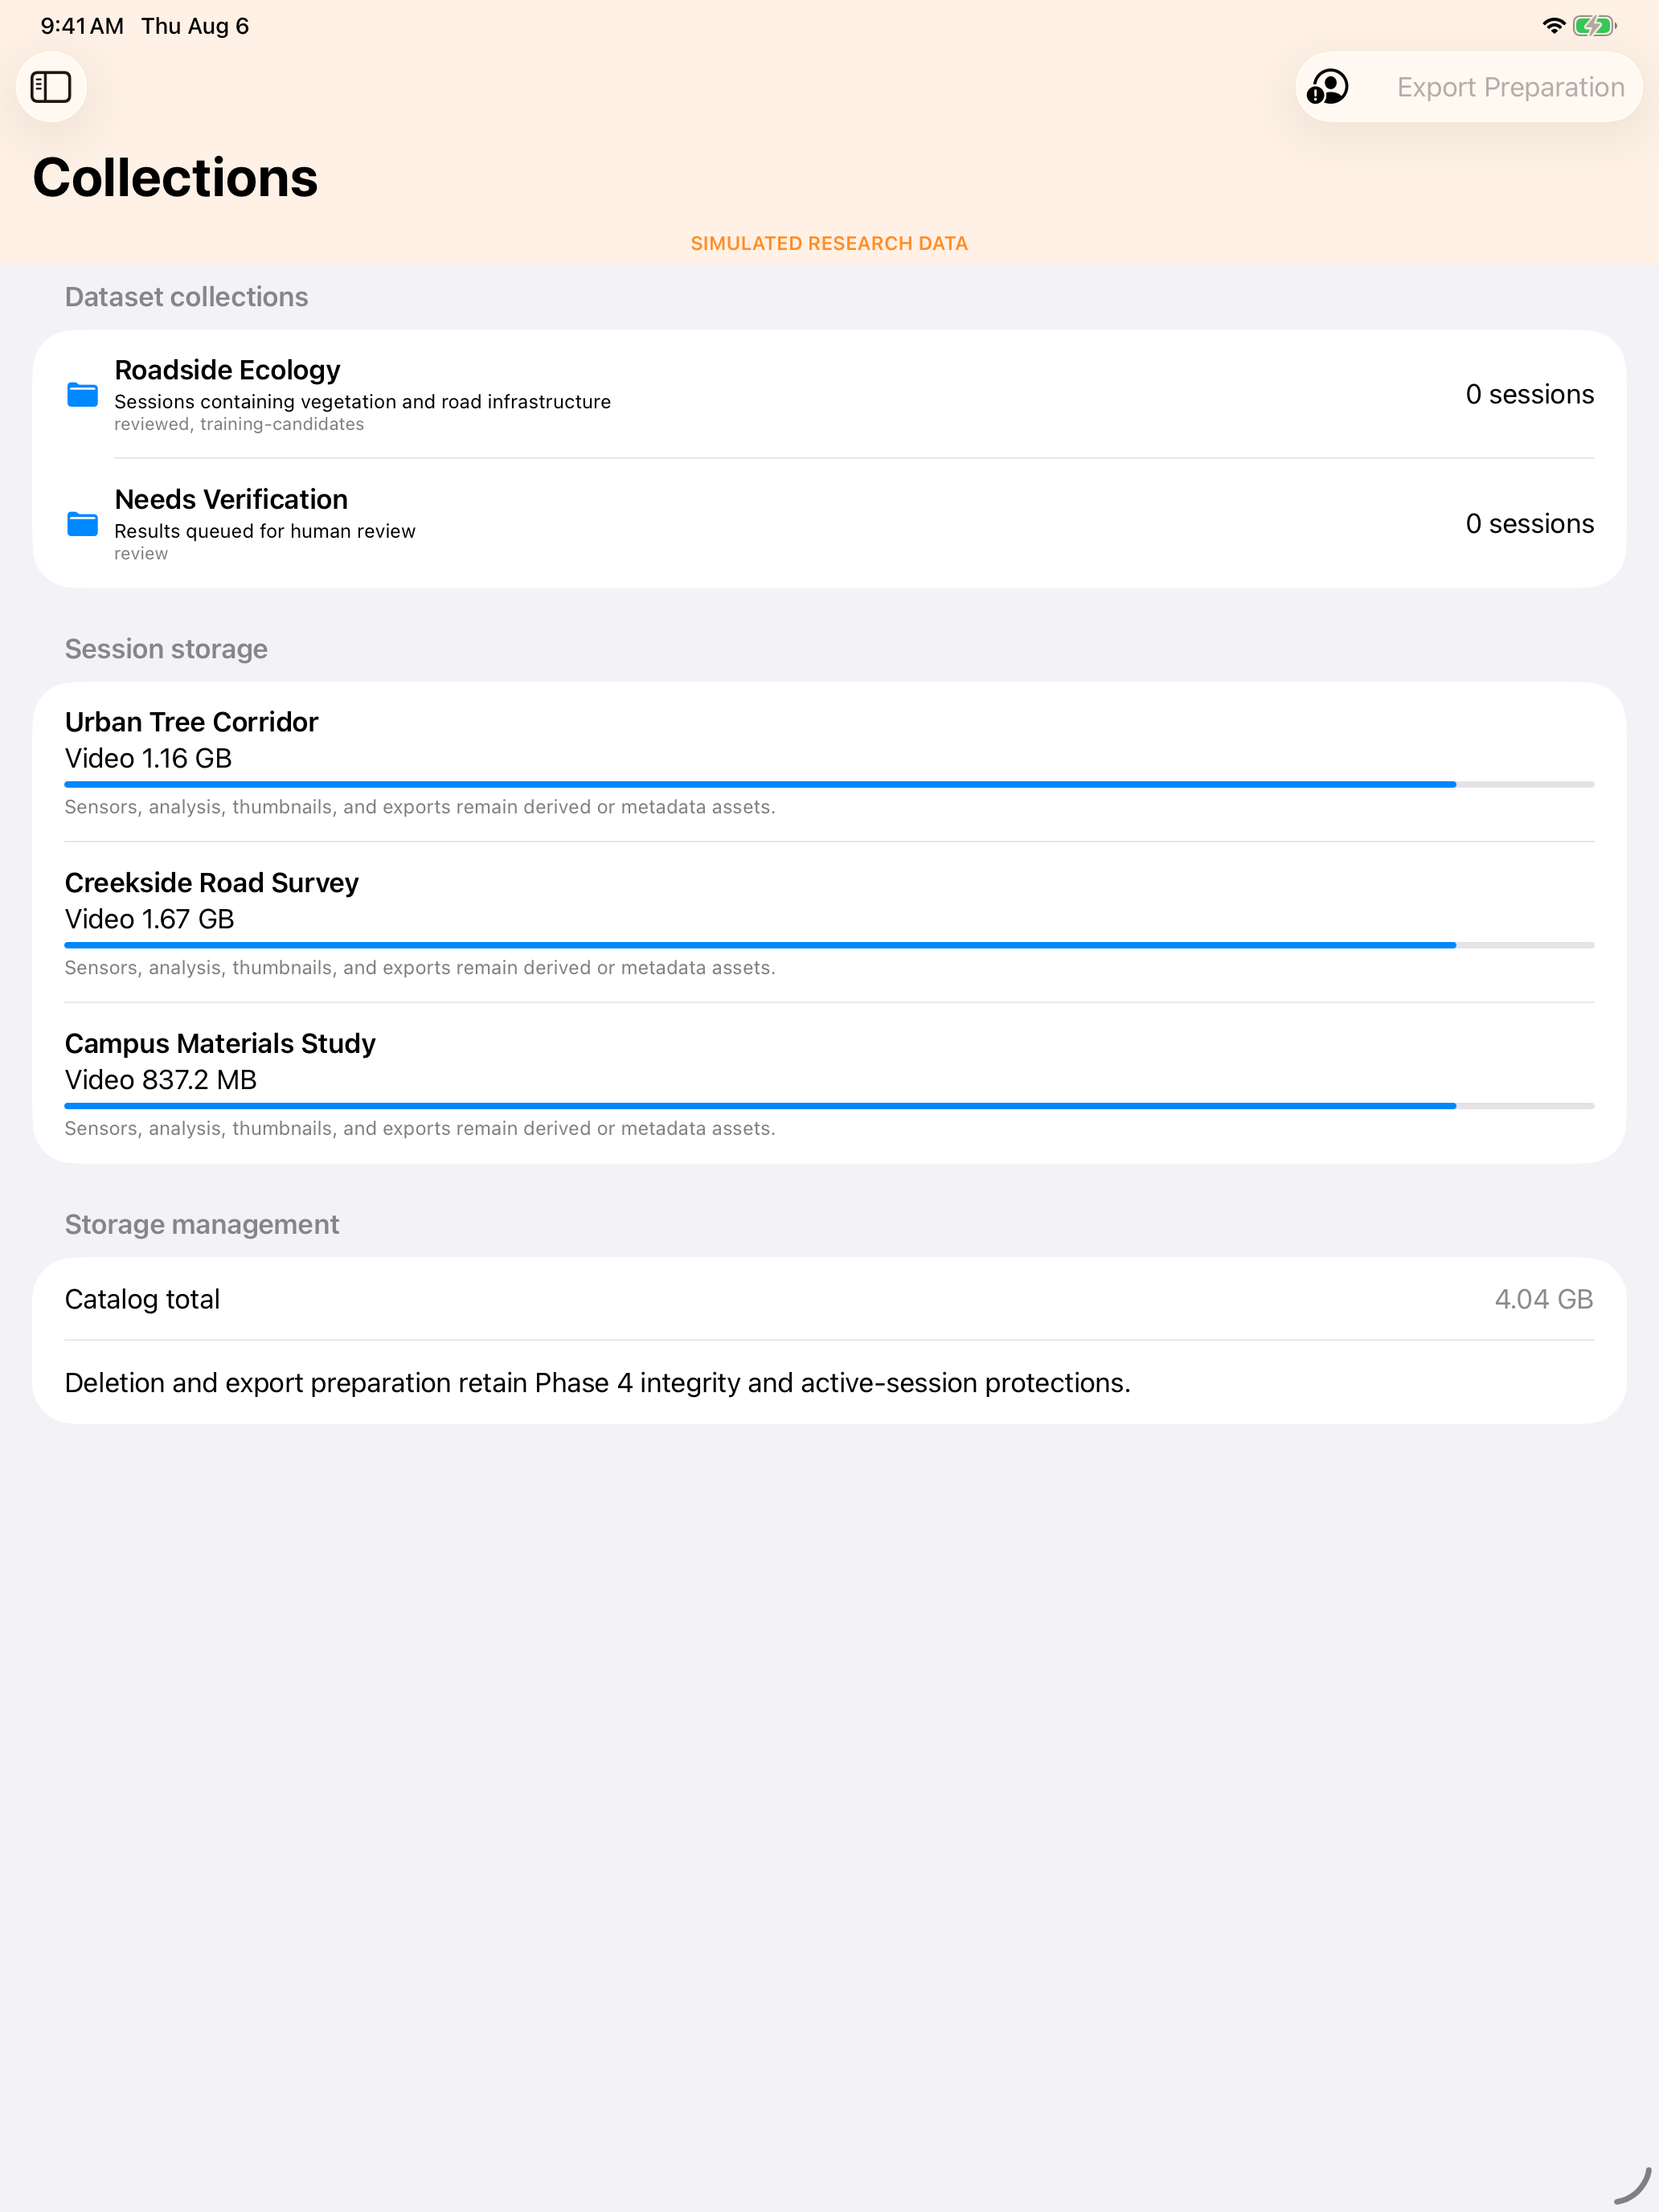
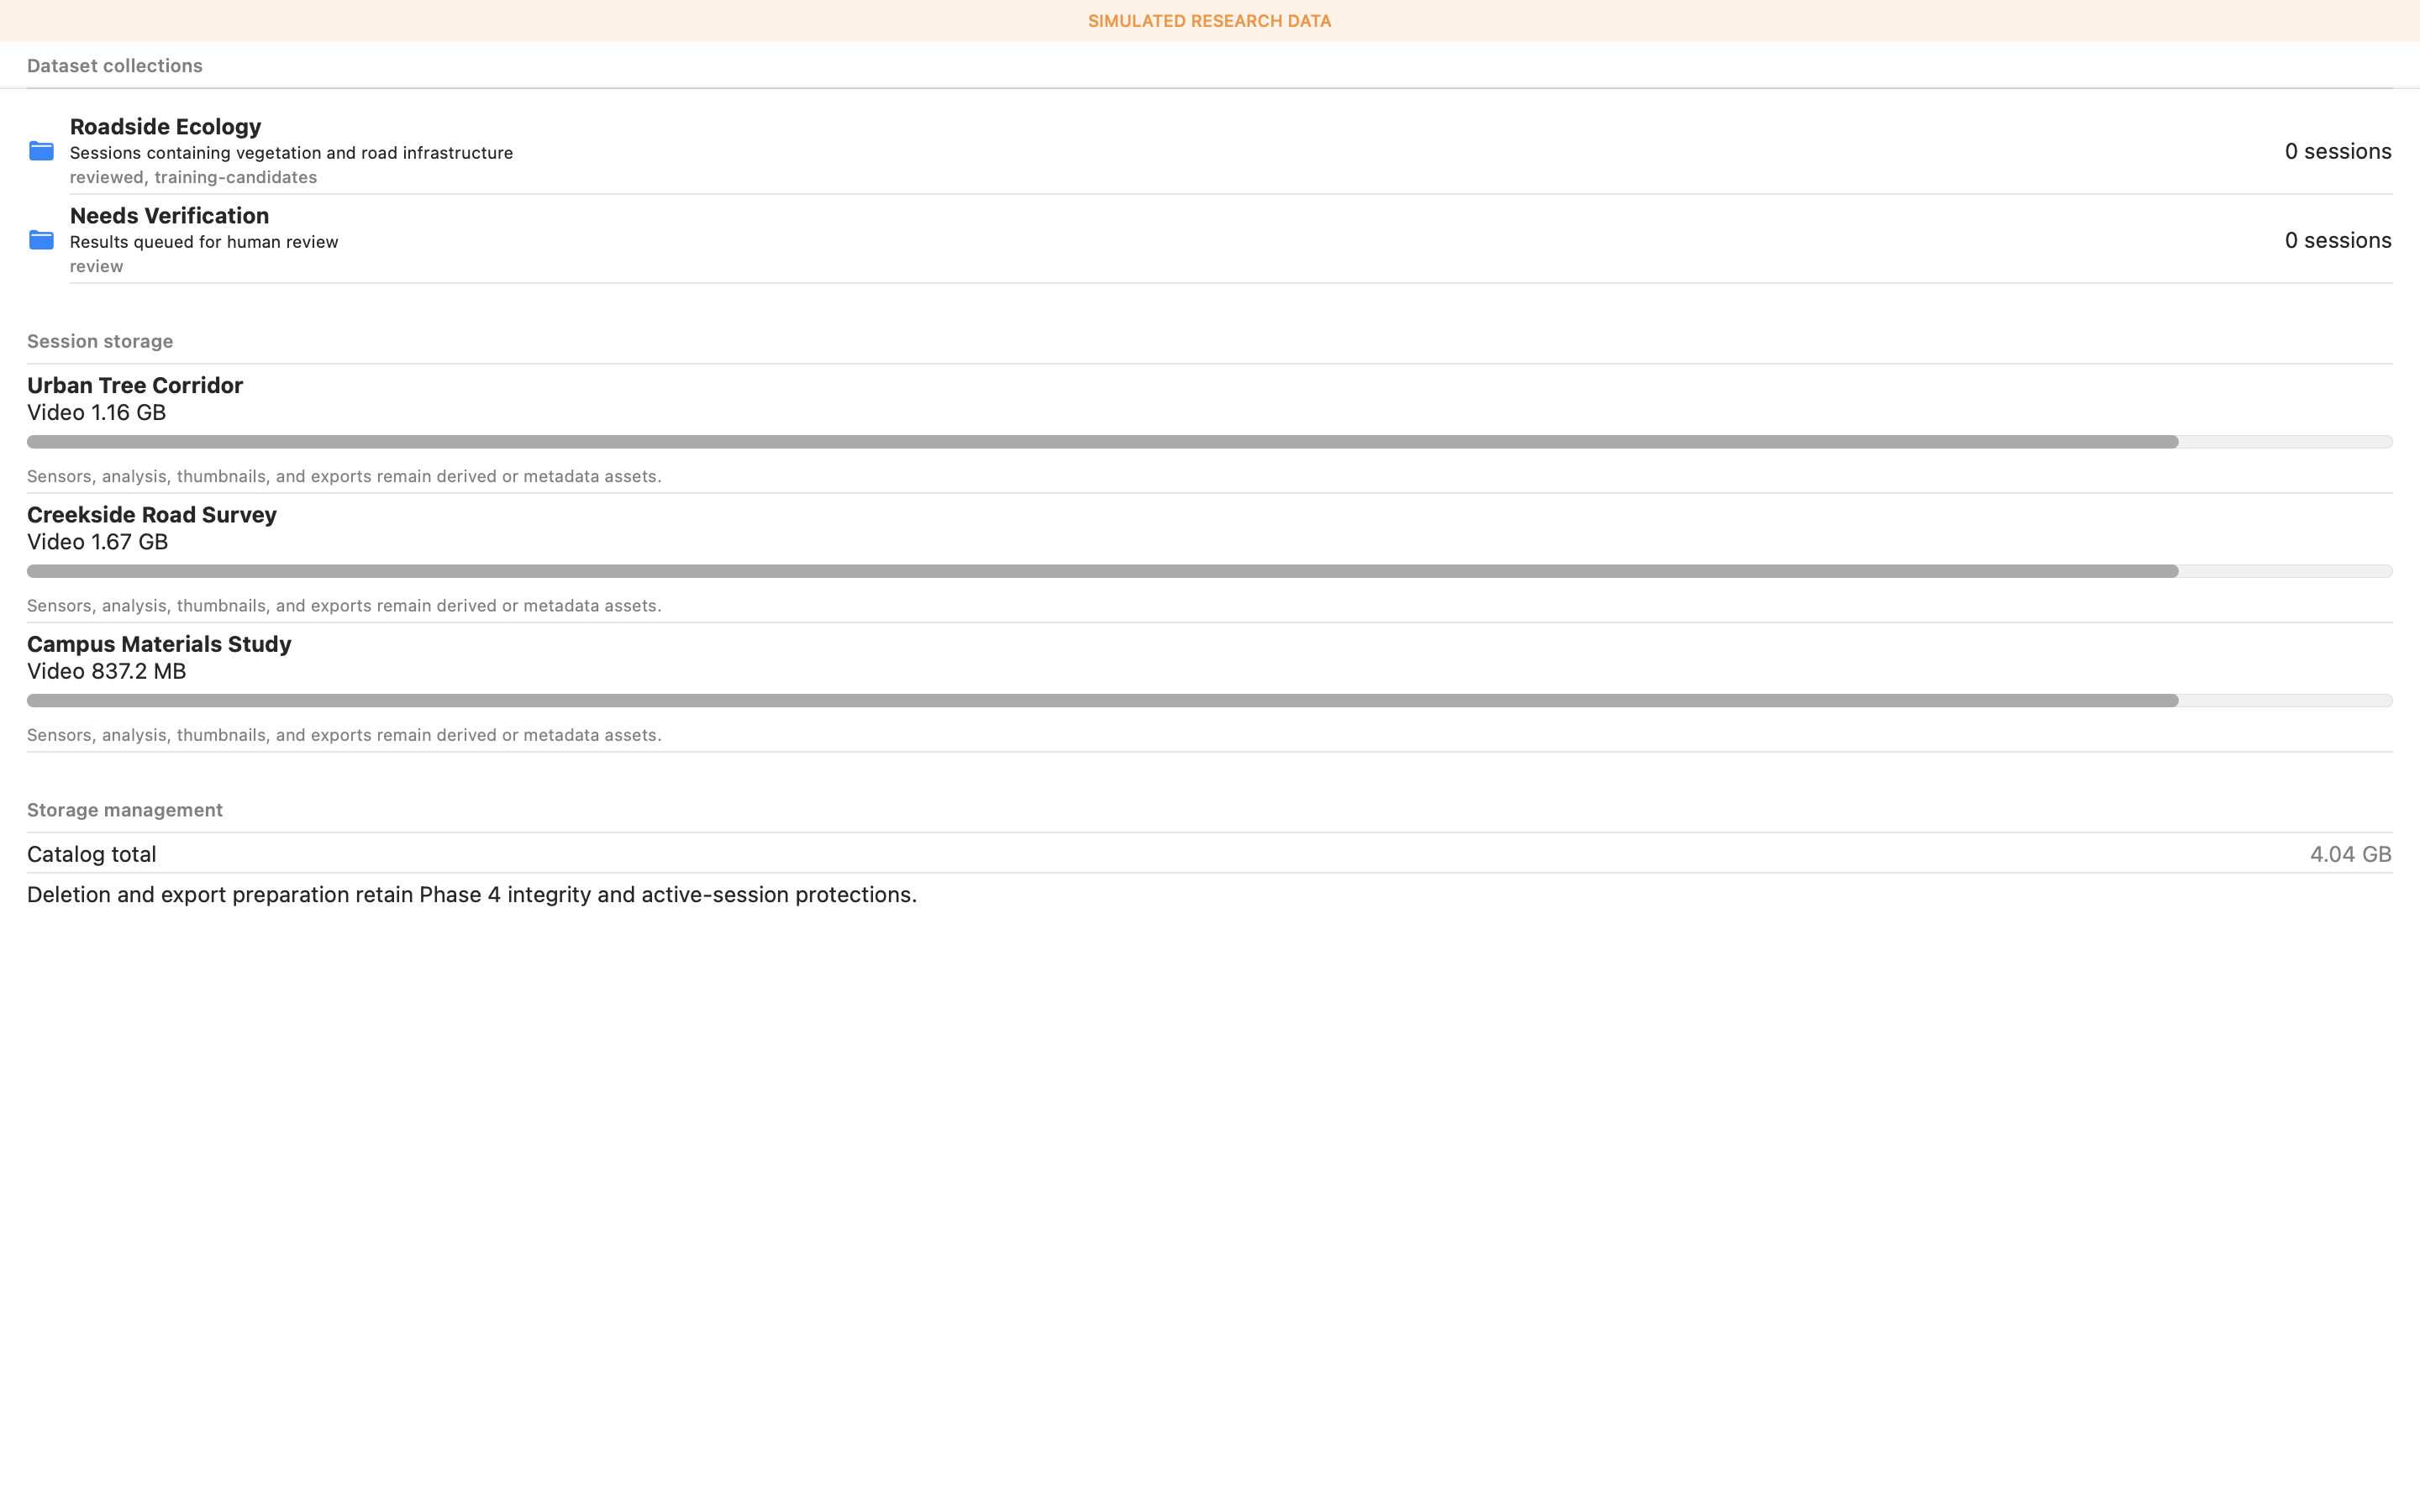
Managing datasets
Collections organize sessions without changing immutable packages. Storage summaries separate source video from sensor, analysis, thumbnail, and export assets.
Correcting and Preparing Training Data
Human work lives in a versioned annotation layer, while source video and AI results remain unchanged and comparable.
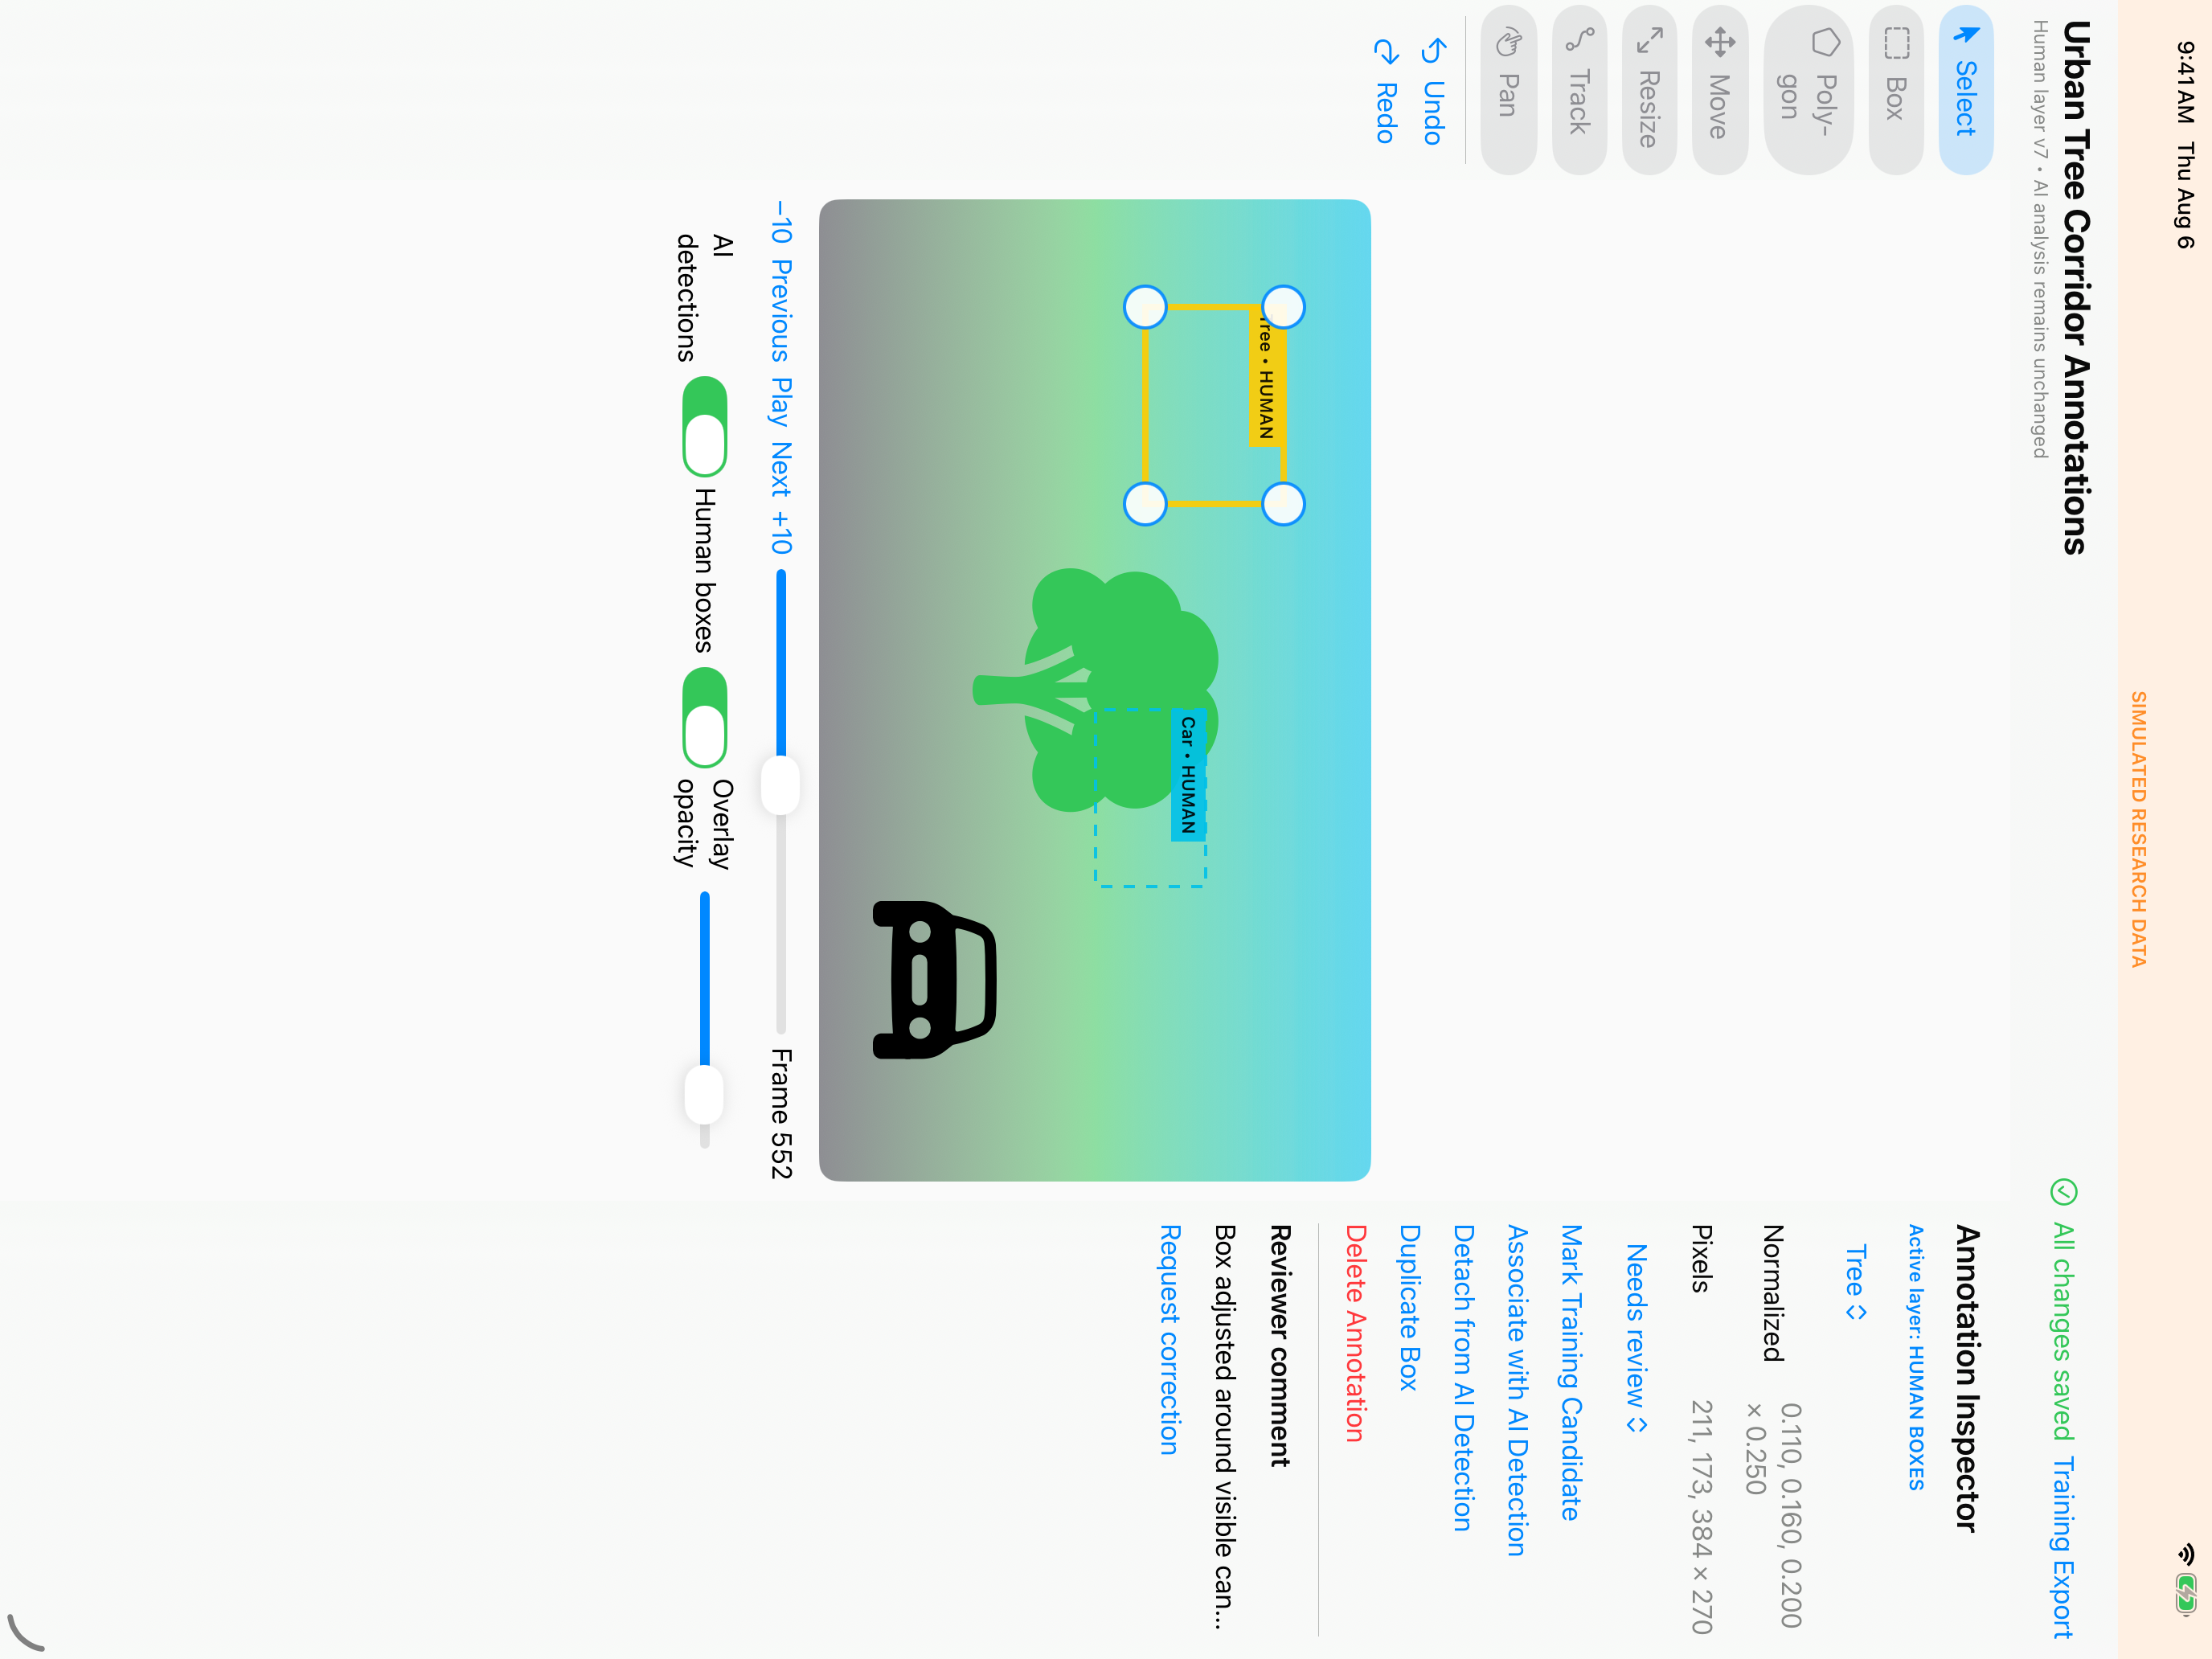
Review queues, track correction, autosave, revisions, and reviewer comments prepare approved examples without claiming that review guarantees correctness.
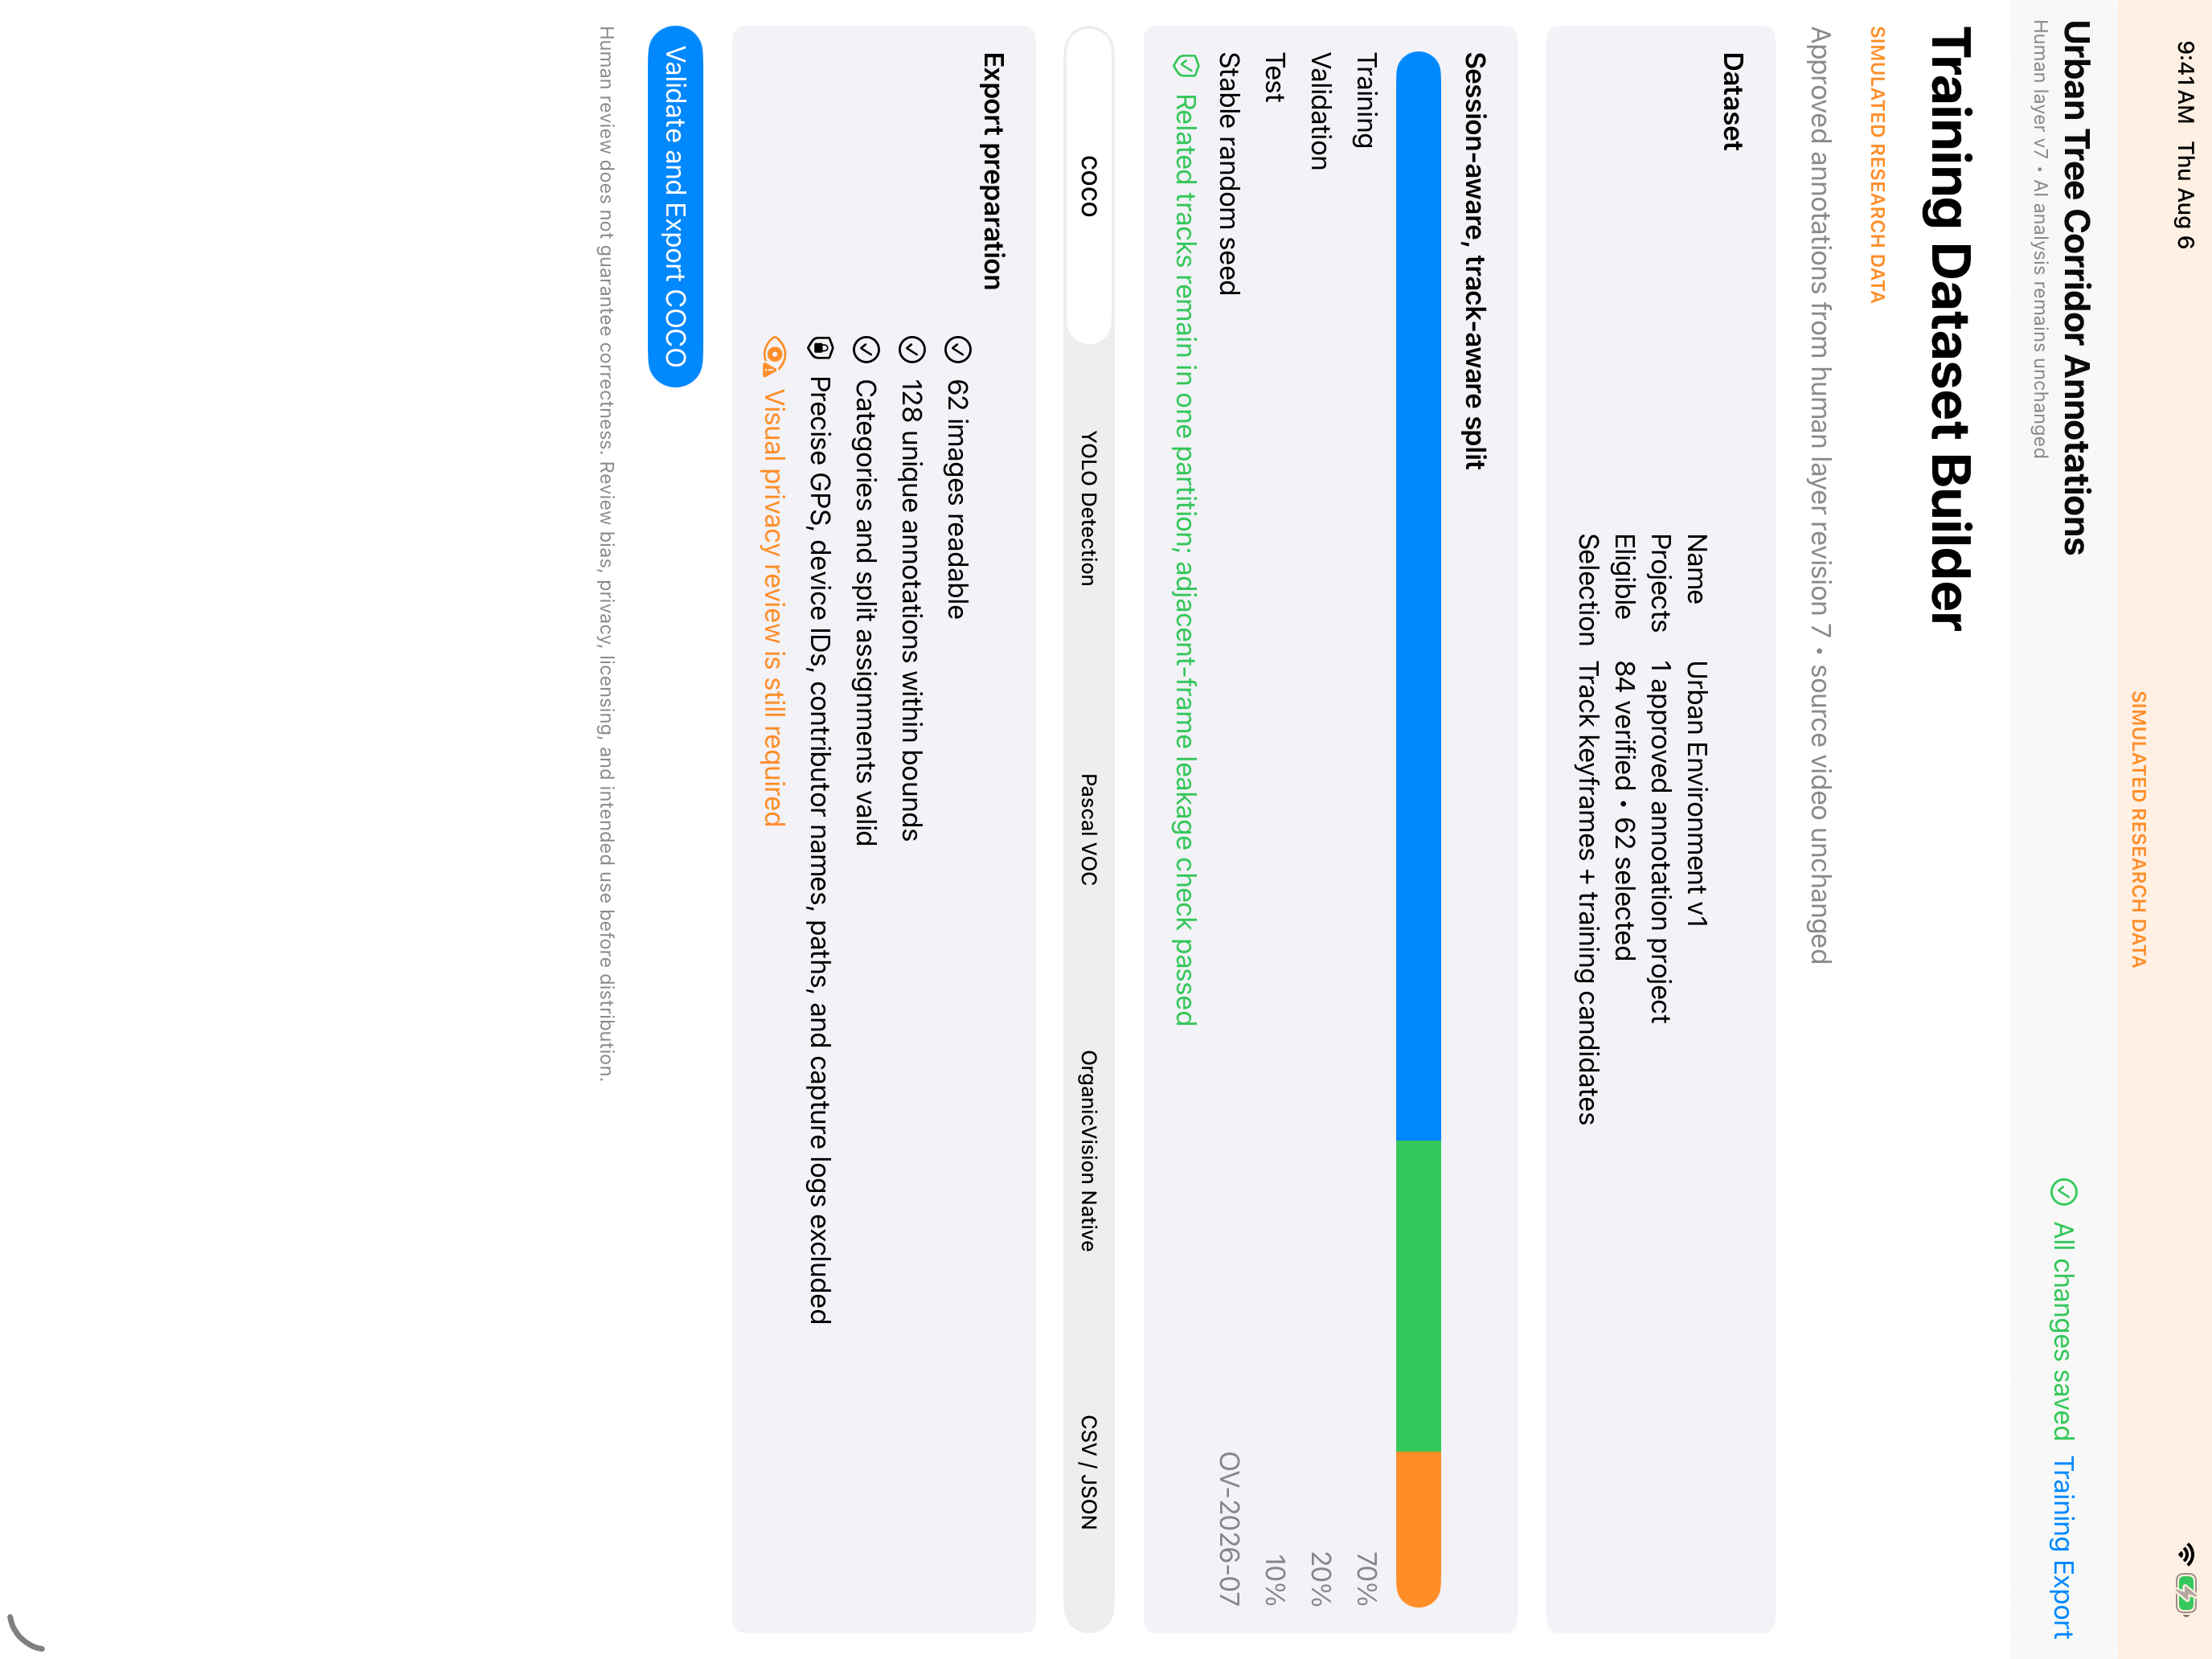
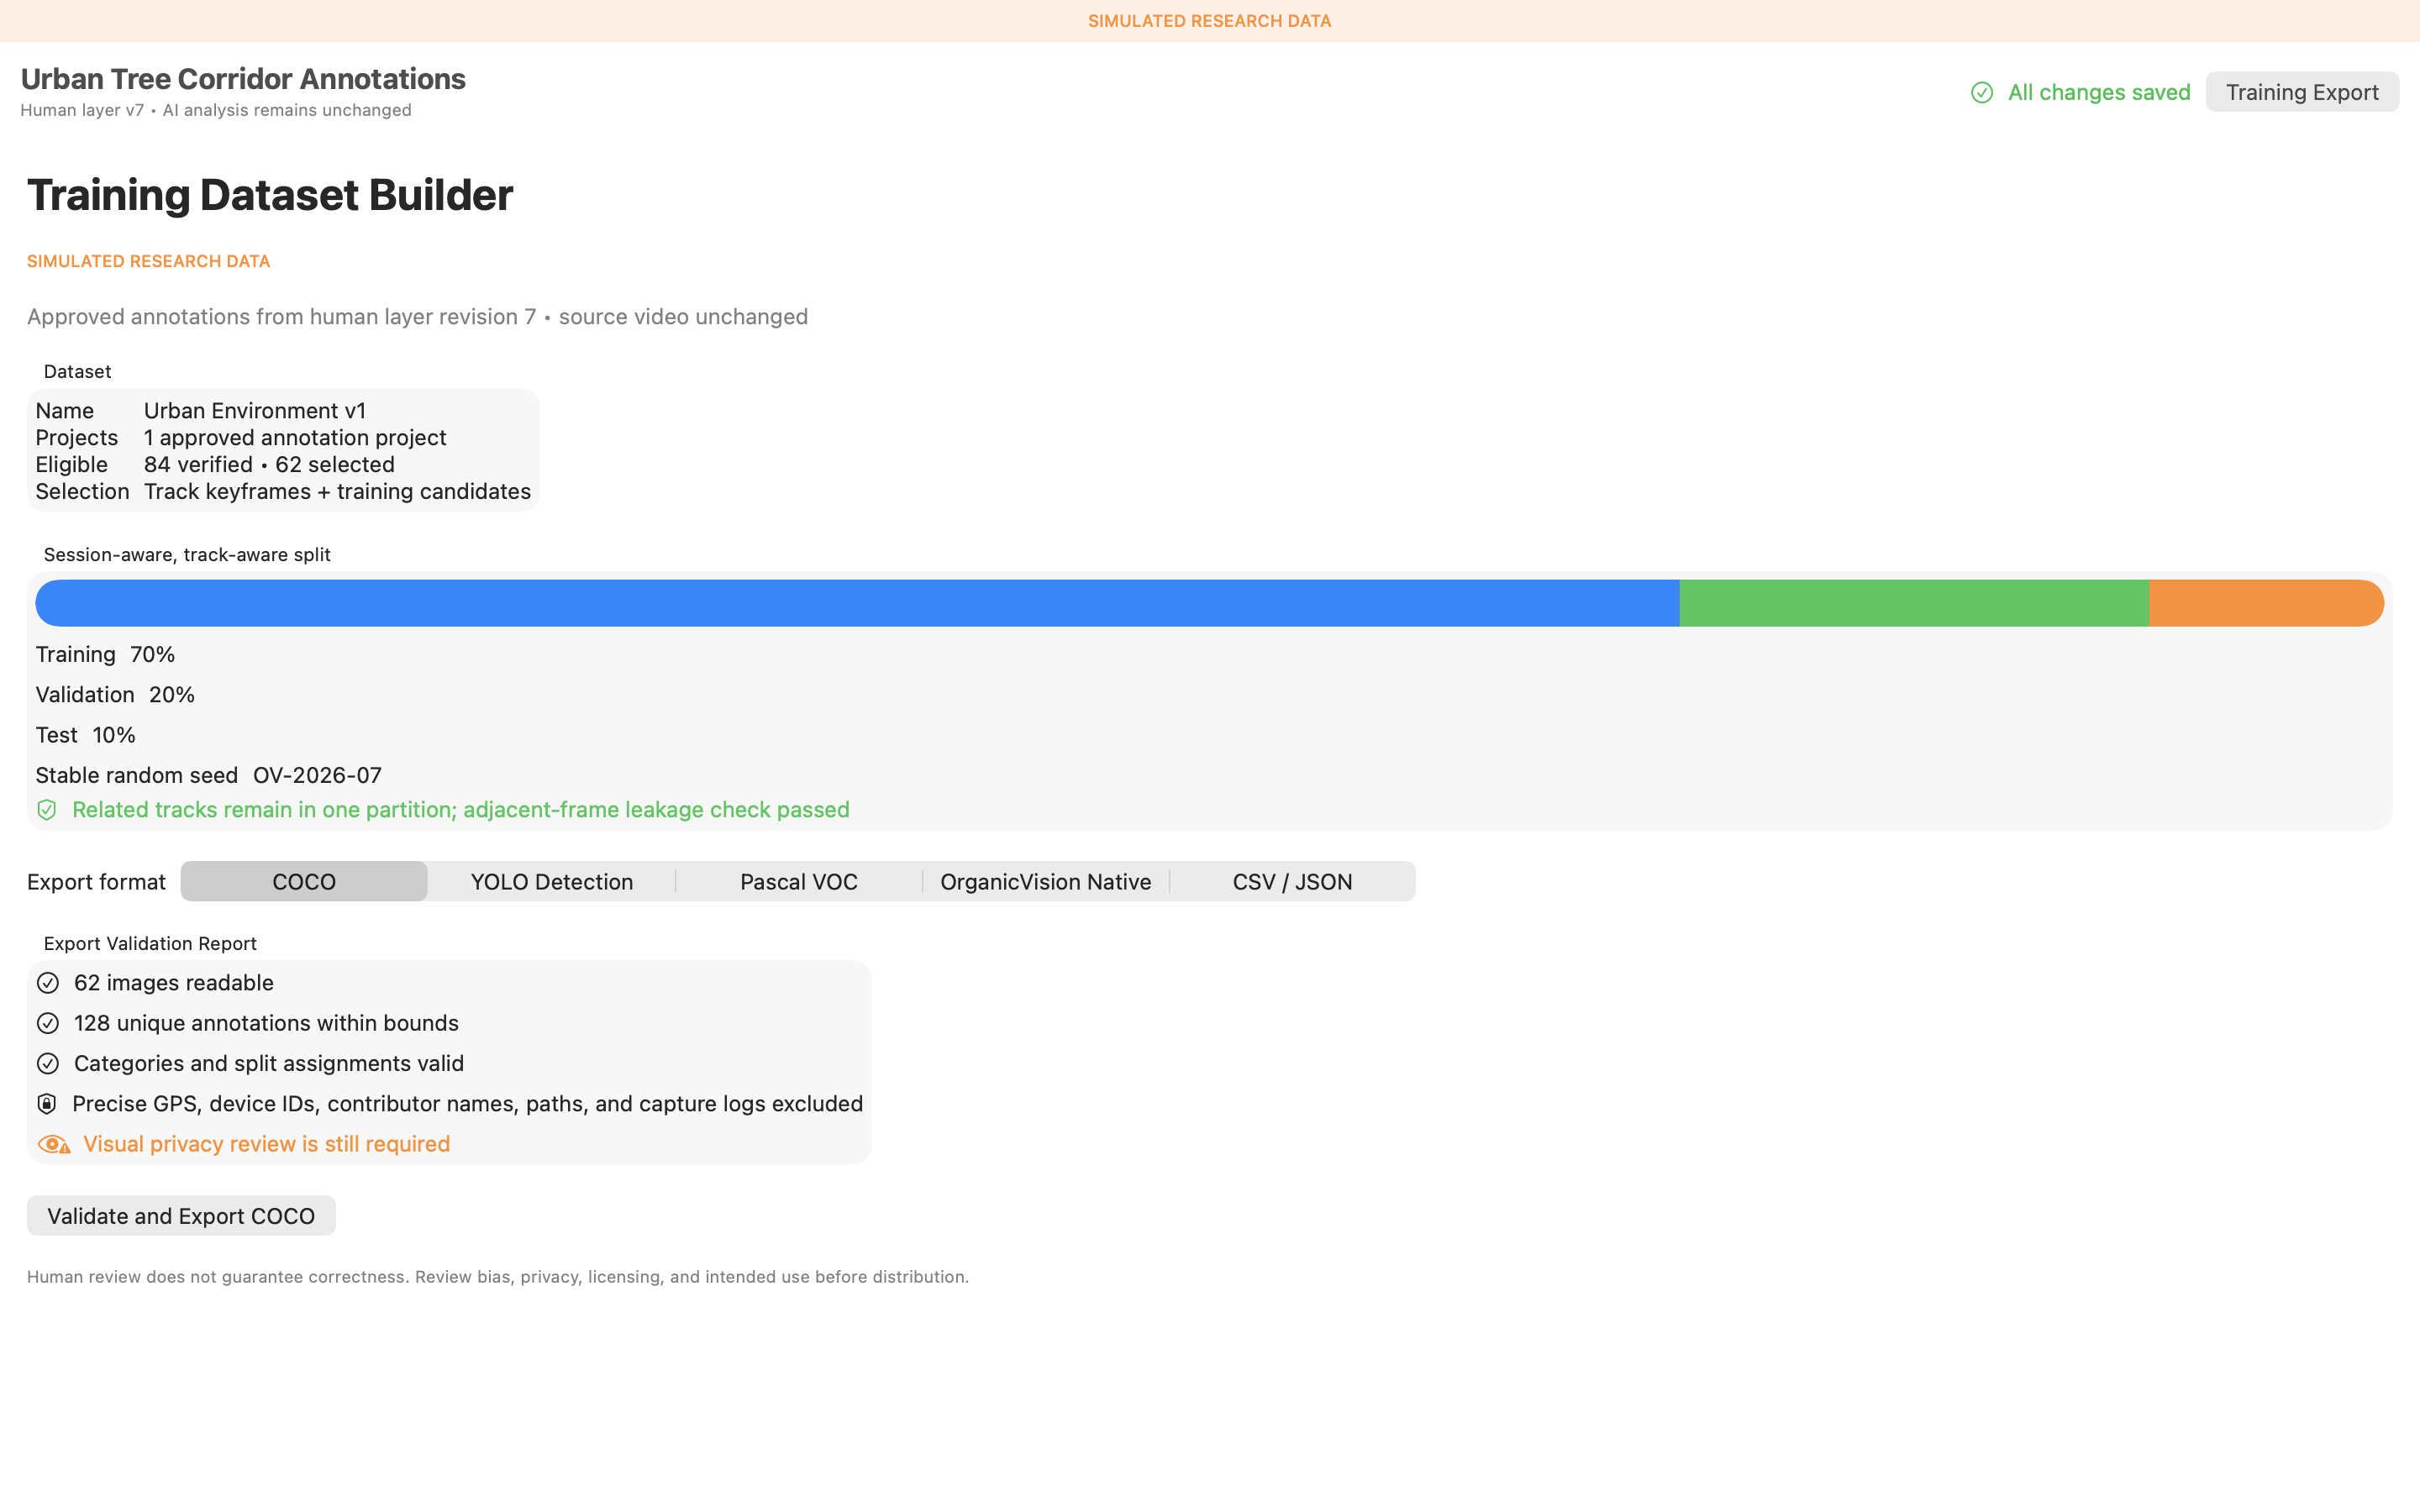
Exports are validated before finalization and exclude sensitive metadata by default. Visual privacy and licensing review remain the exporter’s responsibility.
Reviewing Assistance and Segmentation
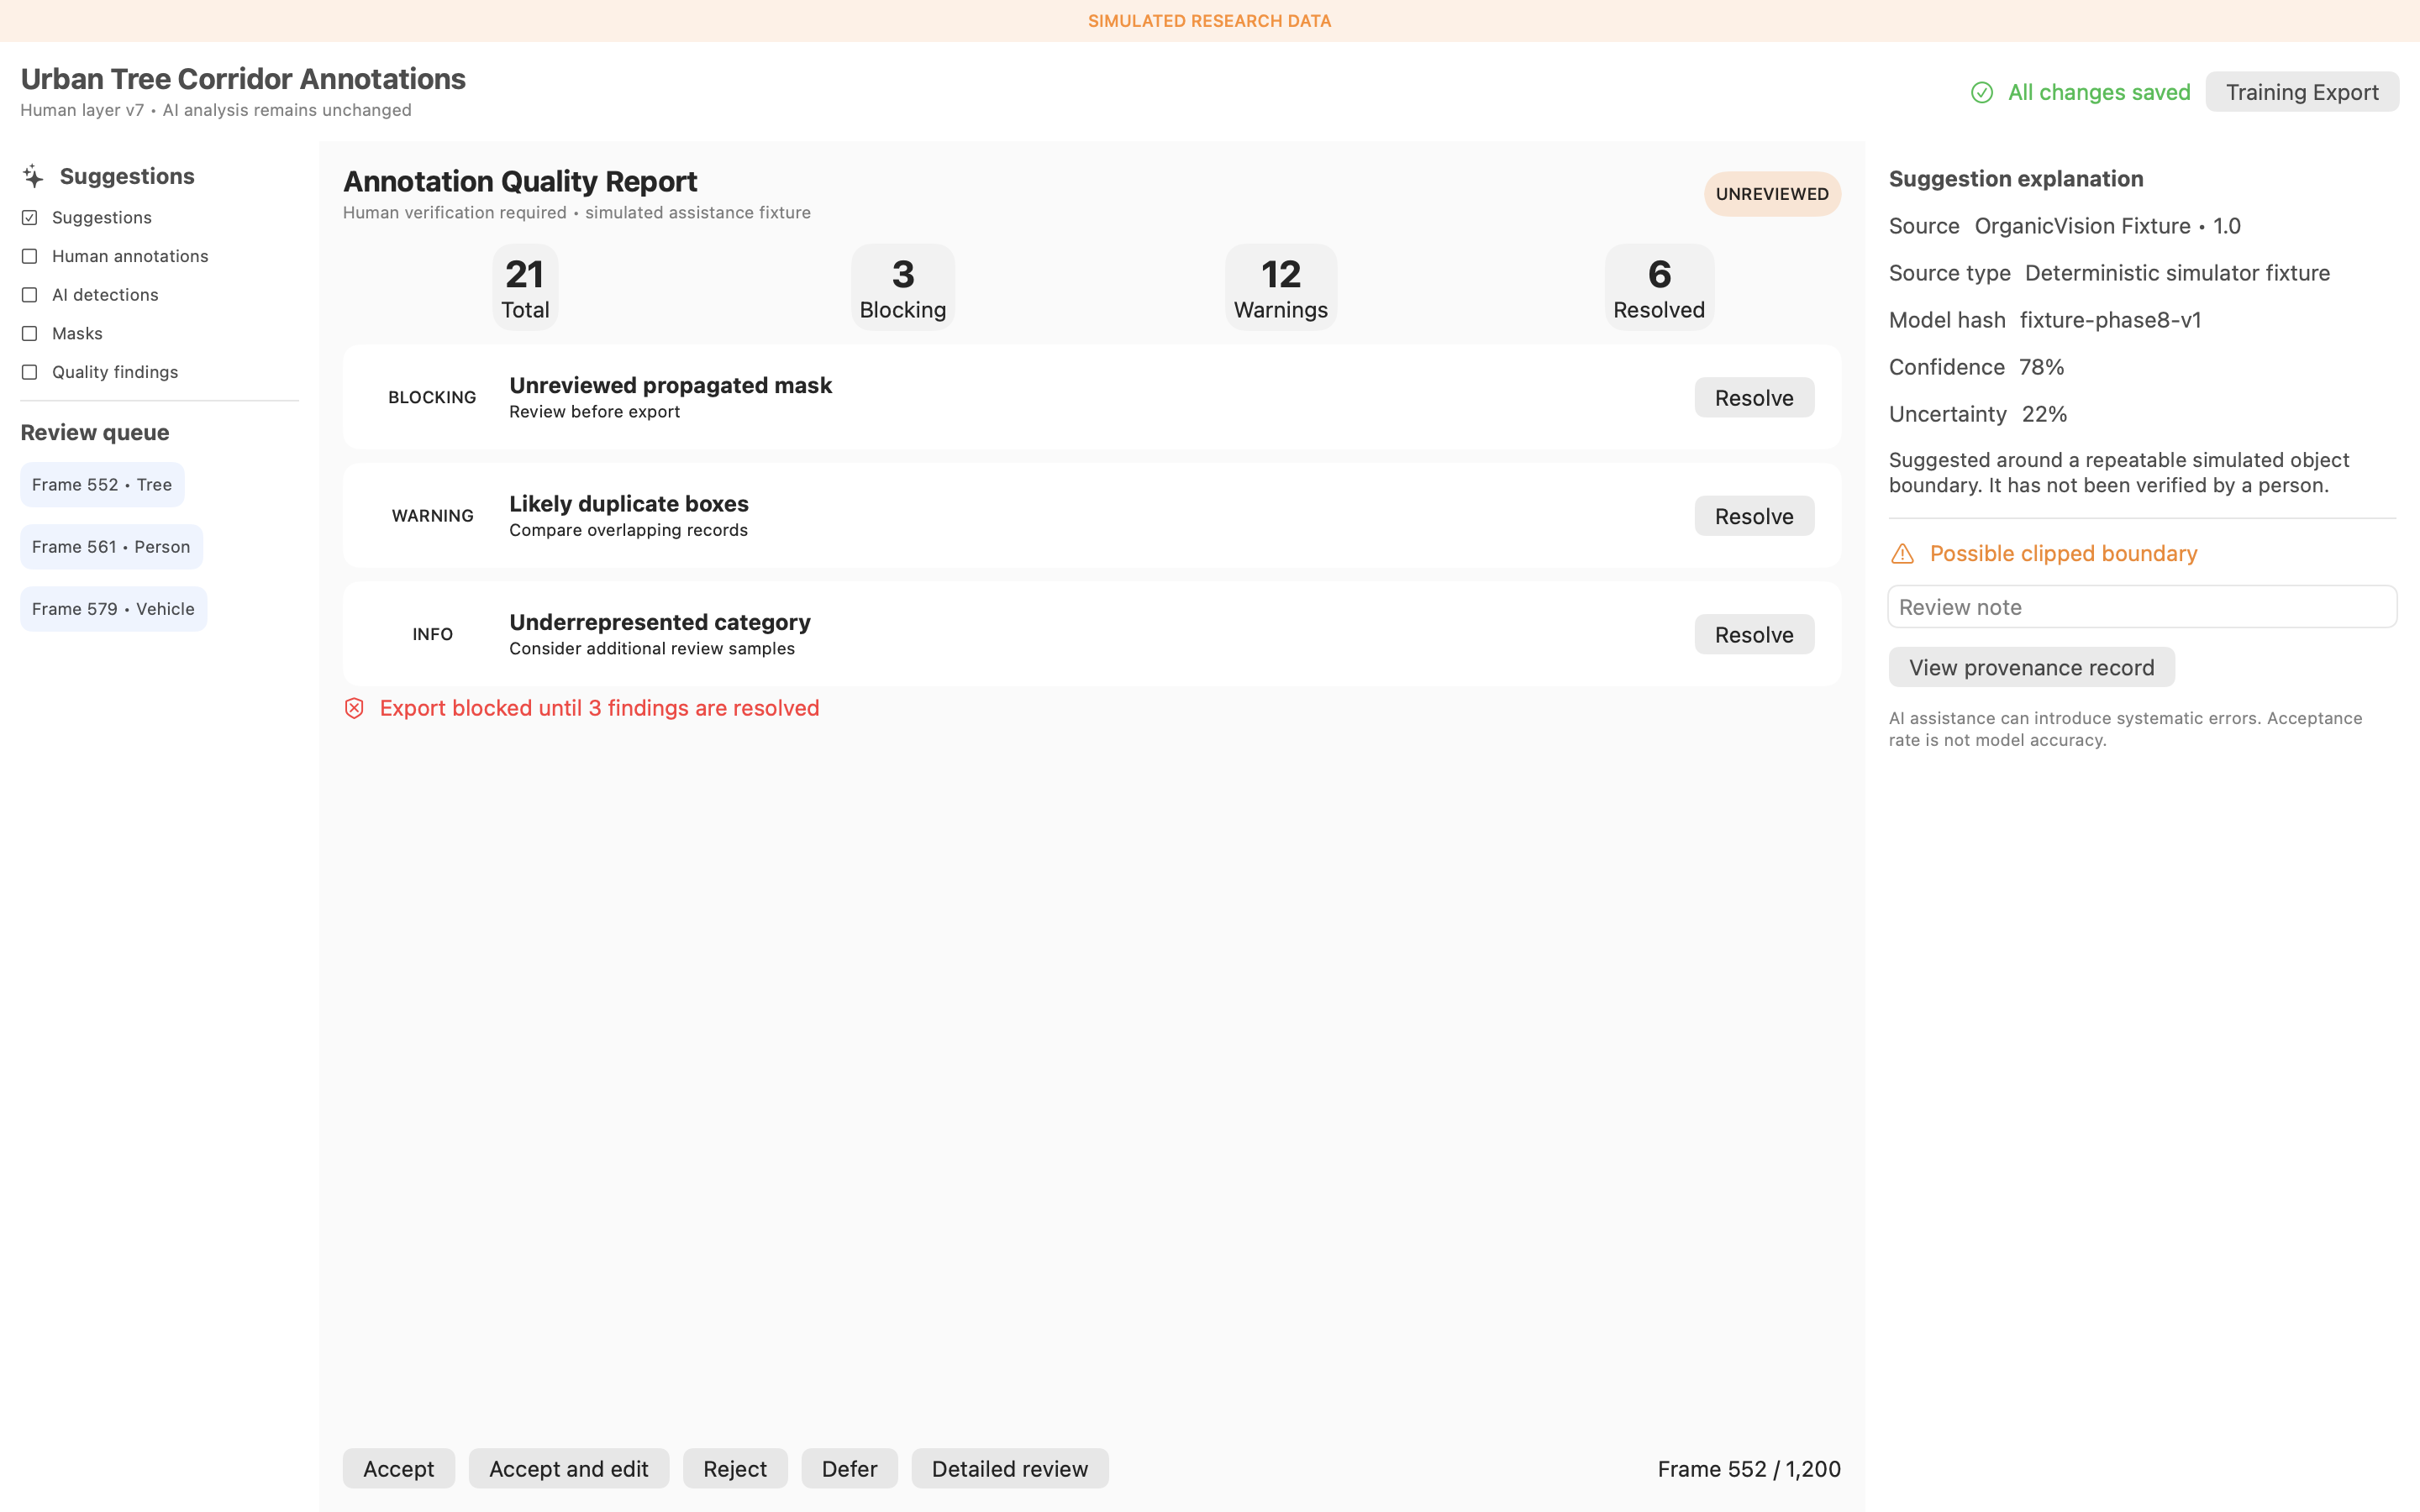
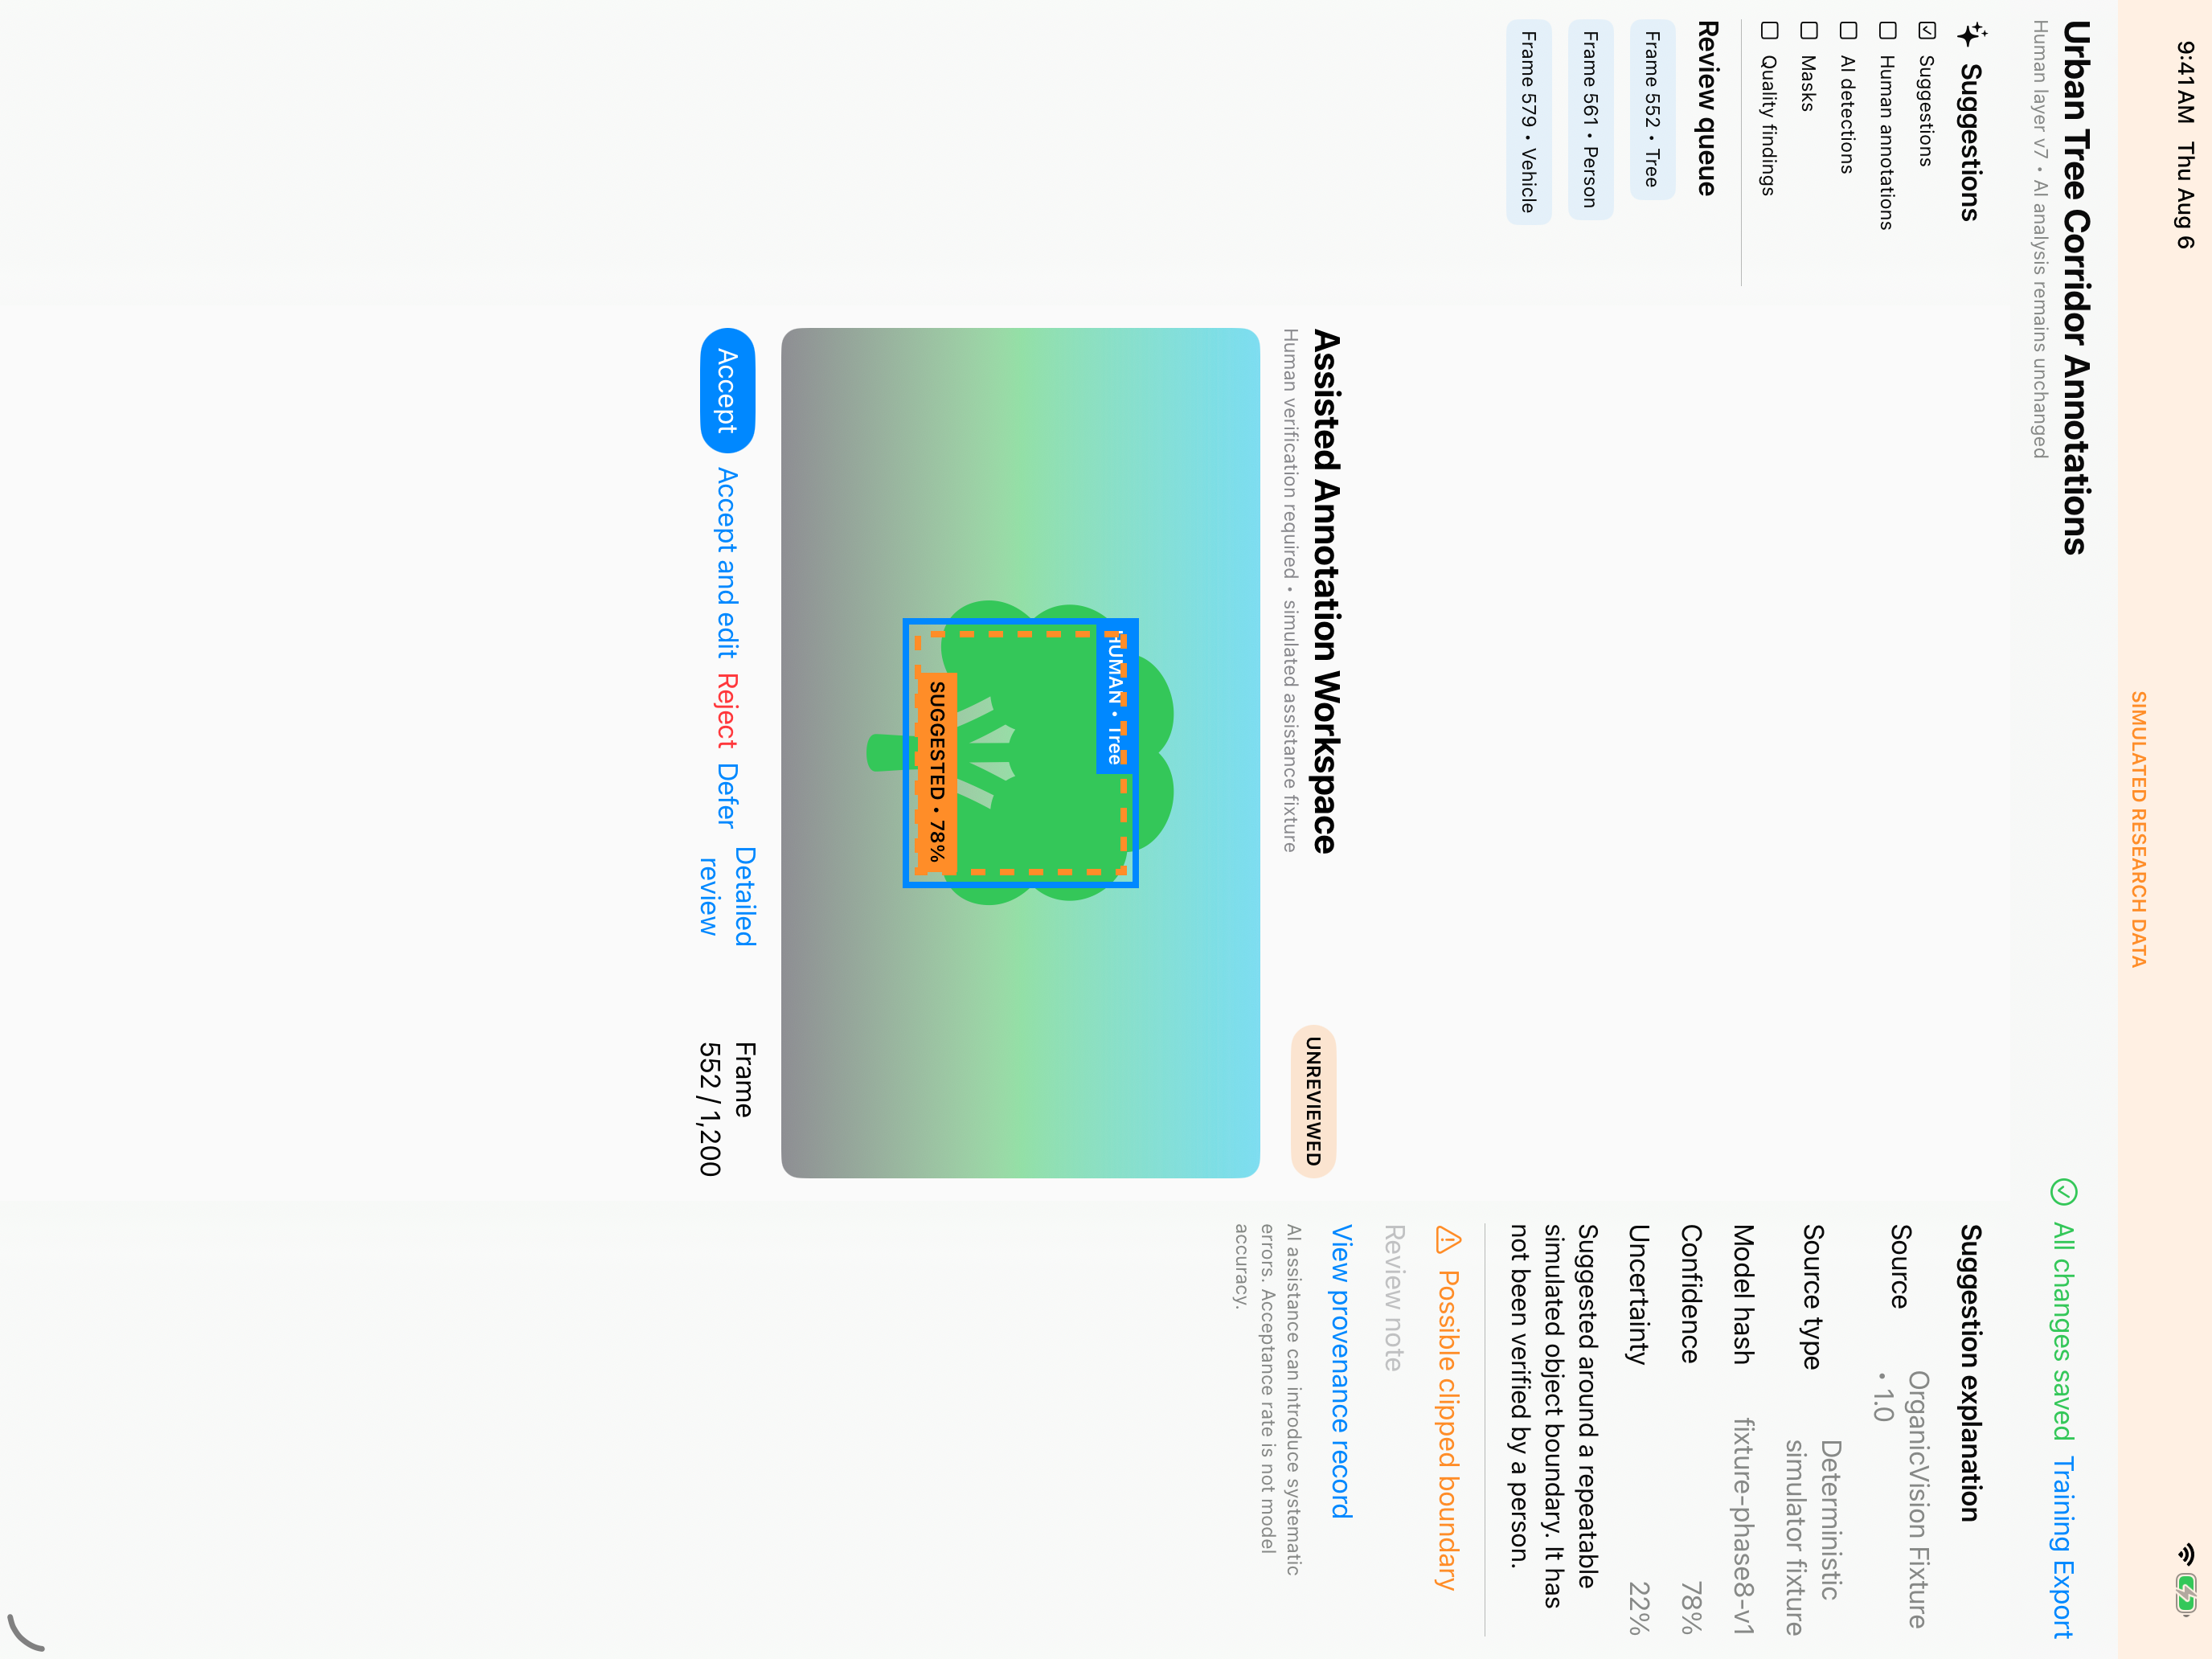
Suggested geometry uses its own labeled layer. A reviewer must accept, edit, reject, or defer it; no suggestion silently replaces a human record.
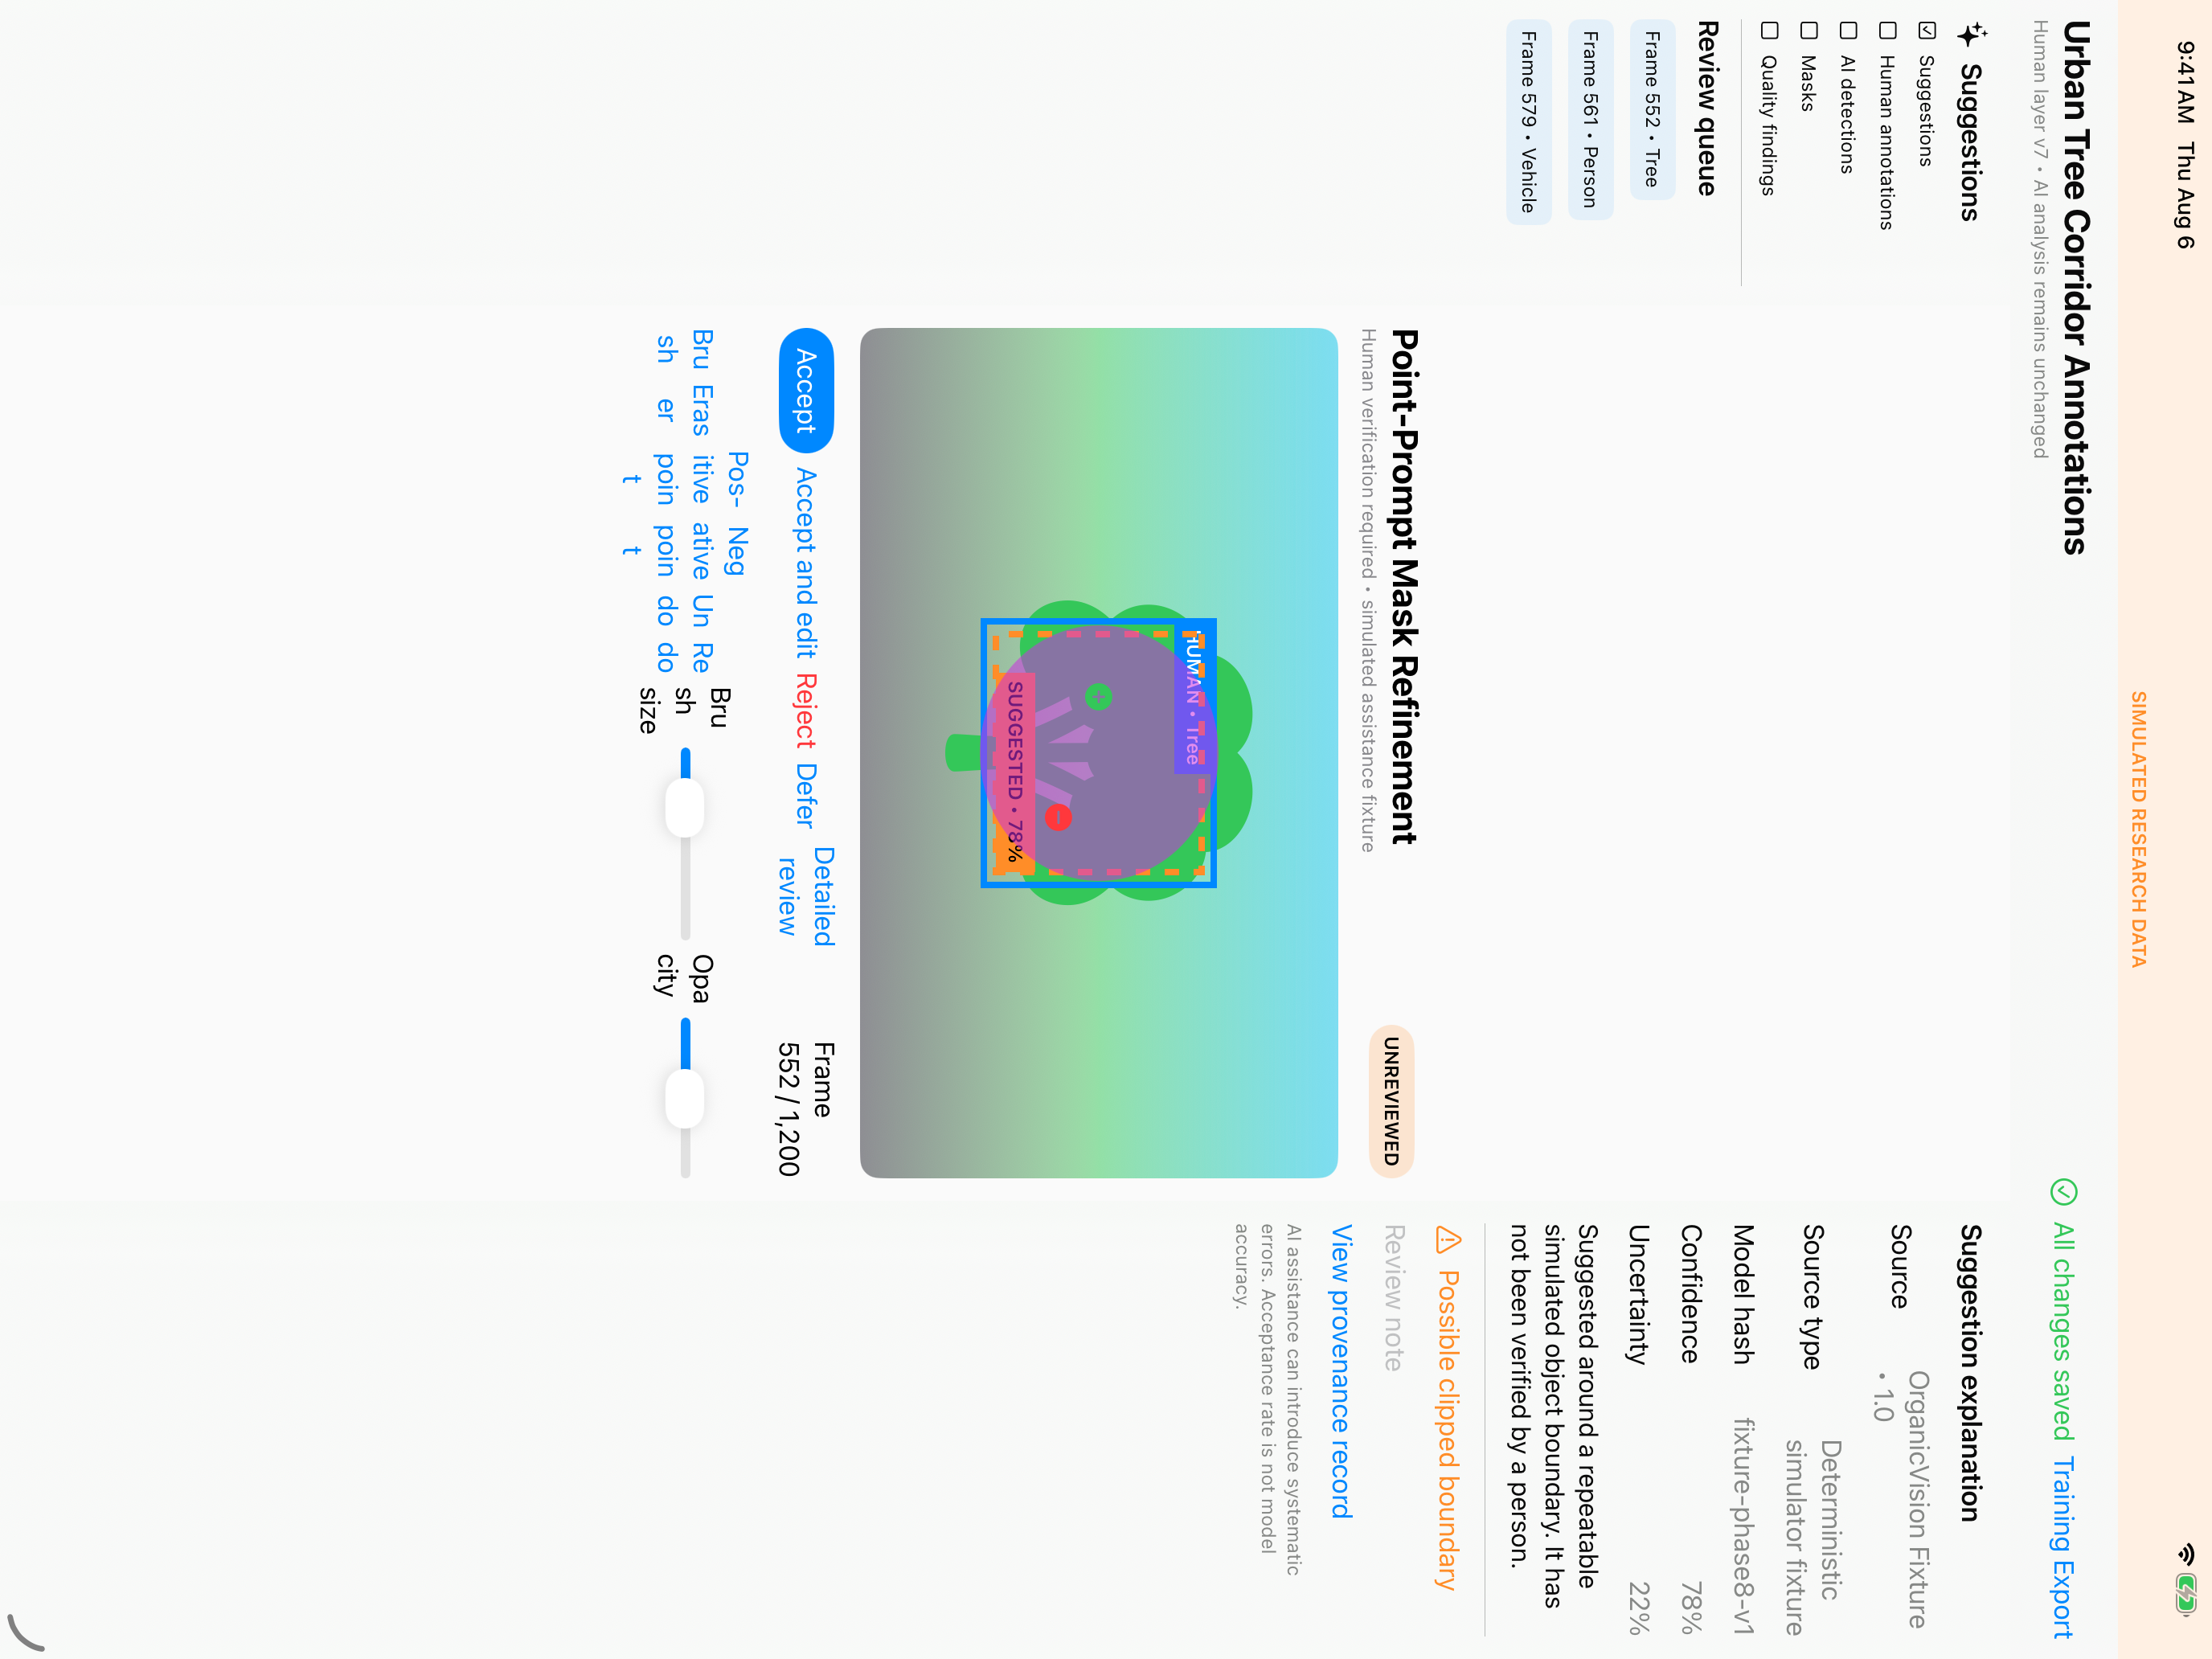
Mask tools expose brush size, opacity, point prompts, and text states without requiring color perception or Apple Pencil.
Queues explain why work was prioritized, while quality reports show which findings block export. Multiple model outputs are compared neutrally.